
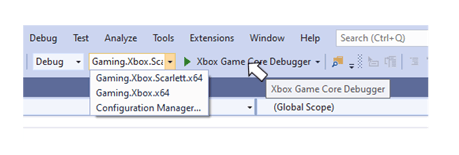
Debugging XBOX Microsoft Game Development Kit (GDK) projects from within Visual Studio is enabled by the XBOX Debugger component that’s installed as part of the Microsoft Game Development Kit (GDK). Visual Studio 2019 and 2022 are supported. The XBOX Debugger is the default debugger for all projects whose platform is either Gaming.Xbox.One.x64 or Gaming.Xbox.Scarlett.x64 as shown in the following screenshot. Screenshot of the standard toolbar in Visual Studio, showing the Gaming.Xbox.One.x64 and Gaming.Xbox.Scarlett.x64 platforms in the Solution Platforms drop-down list and the XBOX Debugger as the default debugger

Configuring the Visual Studio debugger

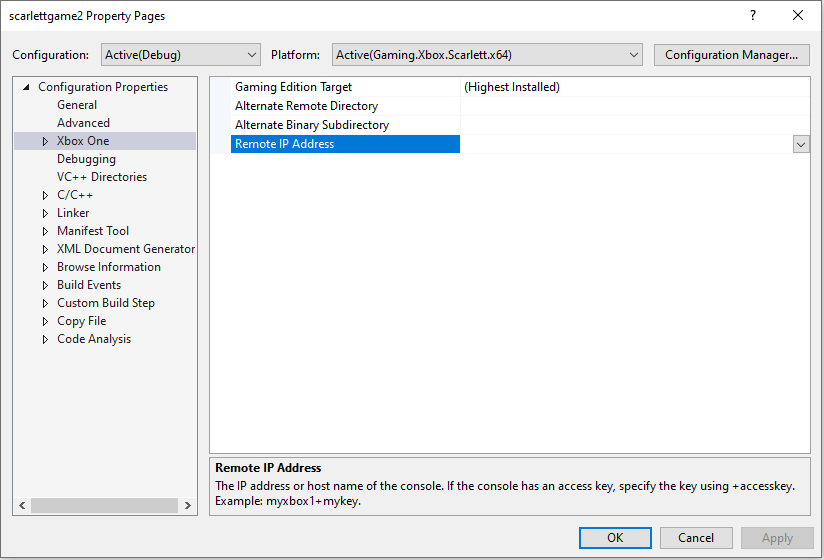
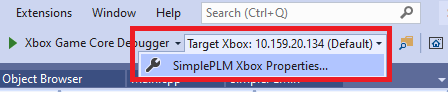
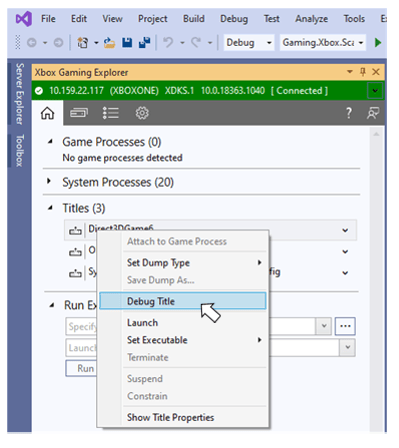
When the debugger is launched by using F5 from within Visual Studio, the default console you’ve set by using other Microsoft Game Development Kit (GDK) tools, such as XBOX Manager or xbConnect, is used by default. To override this behavior, specify a console by using the Remote IP Address property under the XBOX One section of a project’s property page as shown in the following screenshot. Screenshot of the XBOX One section of the Property Pages dialog box for a Visual Studio project, showing the Remote IP Address property in the content pane The debugging toolbar in Visual Studio includes a dropdown that indicates which console the title will be deployed to when launched via F5 or Ctrl-F5. The dropdown has a button that can be used to quickly access the project’s property page if the target console needs to be changed. Target Device dropdown in Visual Studio The debugger can also be launched from the XBOX Gaming Explorer. In this case, the console used is the one that’s identified in the connection ribbon at the top of the XBOX Gaming Explorer as shown in the following screenshot. Screenshot of the XBOX Gaming Explorer in Visual Studio, showing the highlighted Debug Title menu item from the context menu of a title for the console that's identified by the connection ribbon at the top of the XBOX Gaming Explorer
Symbol paths

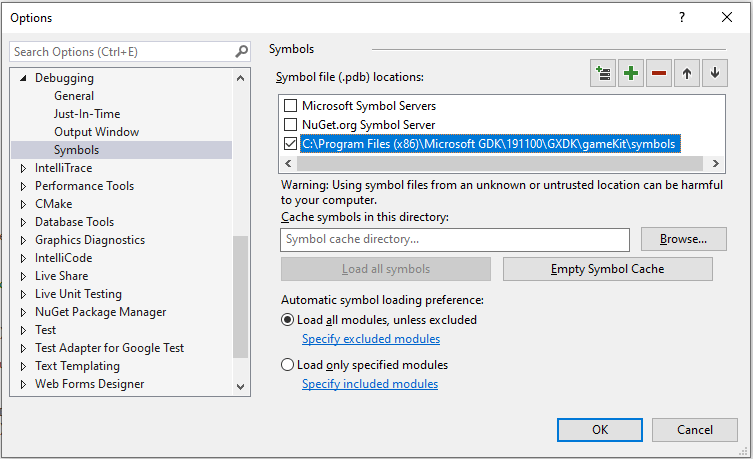
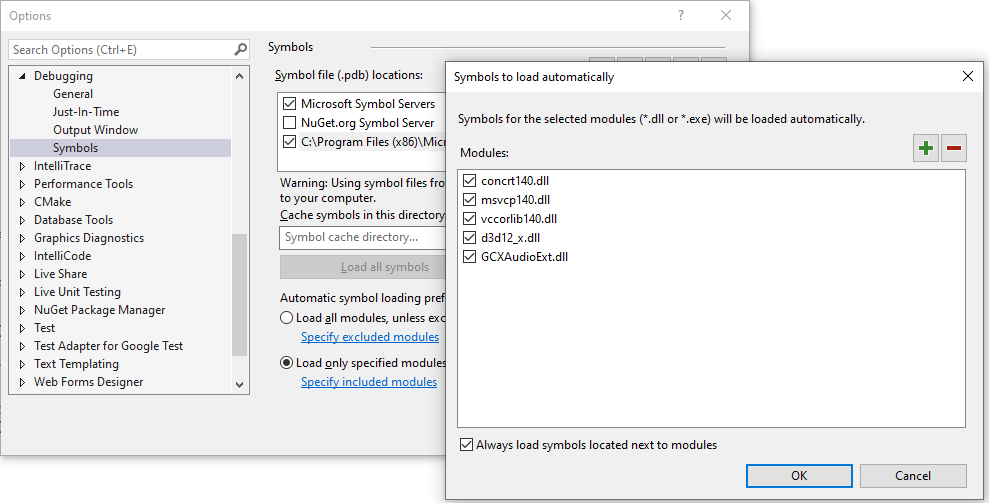
The Program Database (.pdb) files for several Game OS components are available for use when debugging with Visual Studio. Configuring Visual Studio to use these symbols provides more complete callstacks when broken into the debugger, for example. Some of the Game OS symbols are installed on your development PC by Microsoft Game Development Kit (GDK) setup, while others are available on the Microsoft public symbol servers. The Game OS symbols installed by setup are located on the development PC in C:\Program Files (x86)\Microsoft GDK<edition number>\GXDK\gameKit\symbols. Platform-independent .pdbs are in the root of the symbol folder. Platform-specific .pdbs are in the Xbox Series X|S and XboxOne subdirectories. To add the path to the Game OS symbol directory on your local PC, use the Symbols setting under the Debugging section of the Visual Studio Options dialog box as shown in the following screenshot. Screenshot of the Symbols pane from the Debugging section of the Visual Studio Options dialog box, showing the path to the Game OS symbols selected in the Symbol file (.pdb) locations list To access the Game OS symbols that are available on the Microsoft public symbol Server, check the Microsoft Symbol Servers checkbox in the Symbols dialog. Adding Microsoft symbol servers as a symbol file location will cause Visual Studio to search the symbol server for all binaries that are loaded by your title. An exhaustive symbol search can be time-consuming. You can reduce this search time by configuring Visual Studio to only look for .pdbs for a specific set of binaries that your title uses. To specify the set of binaries that Visual Studio should look in for .pdbs, use the Load only specified modules option in the Options dialog box. The following screenshot shows Visual Studio configured to load the symbols from the public symbol server for just a few select binaries. Screenshot of the symbols to load automatically dialog box, displayed over the Symbols pane from the Debugging section of the Visual Studio Options dialog box by selecting the Load only specified modules option The debugger can be further configured through a set of properties that are exposed in the project properties dialog box and in the Settings tab of the XBOX Gaming Explorer. These properties include, for example, the ability to pass command-line arguments to your title and turn on log module loading. For details about the available properties, see Visual Studio Properties for XBOX Development and XBOX Gaming Explorer.
Attaching to a running title

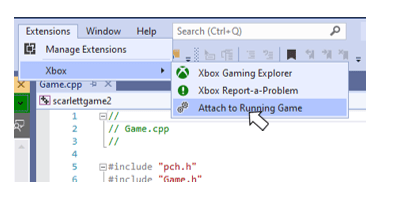
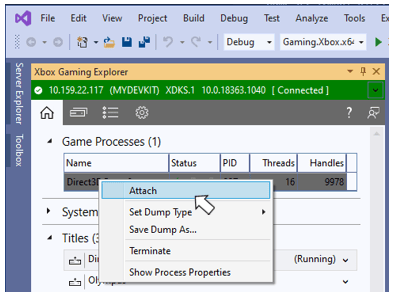
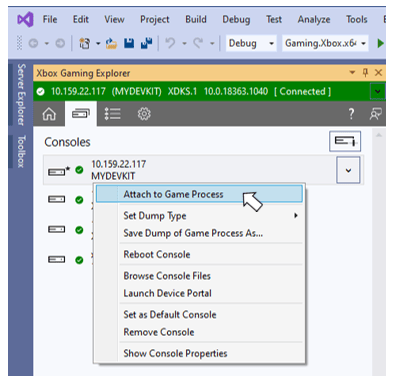
The XBOX menu and the XBOX Gaming Explorer include menu options for attaching the debugger to a game that’s running on a console. To attach to the game that’s currently running on your default console, use Attach to Running Game on the XBOX menu. The XBOX menu is accessible from the Visual Studio menu bar as shown in the following screenshot. Screenshot of the XBOX menu under the Extensions menu from Visual Studio, showing the Attach to Running Game menu item You can also attach to a game that’s running on any console that you’ve added with the XBOX Gaming Explorer. The context menus in the Game Processes and Titles sections of the Home tab include menu items for attaching to a running game as shown in the following screenshot. Screenshot of the XBOX Gaming Explorer in Visual Studio, showing the highlighted Attach menu item from the context menu of a game process for the current console The context menu for a specific console in the Consoles tab attaches to the game running on that console as shown in the following screenshot. Screenshot of the Consoles tab from the XBOX Gaming Explorer in Visual Studio, showing the highlighted Attach to Game Process menu item from the context menu of a console The Attach dialog under Visual Studio’s Debug menu can also be used to attach to a running title. When using Visual Studio 2022, select XBOX Direct Connection in the Connection Type dropdown and enter the either the console’s Host IP address or System IP address in the Connection Target text box. The Host and System IP addresses can be determined using the xbconnect command line tool.
Although either the Host IP or the System IP address can be used to attach to a title, avoid mixing the two when attaching multiple times in a single session. For example, if you initially attach using the Host IP, continue to use the Host IP on subsequent attaches.
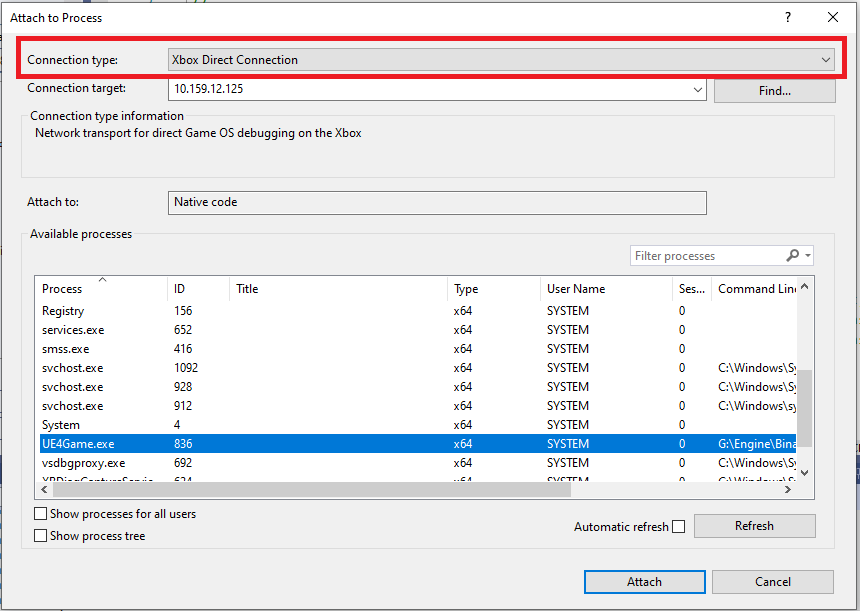
Using the Visual Studio 2022 attach dialog When using Visual Studio 2019 select Remote No Authentication in the Connection Type dropdown and enter the console’s Host IP address in the Connection Target text box.

Debugging XBOX projects using Visual Studio 2022

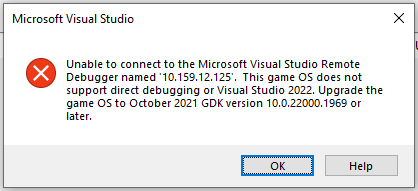
Debugging with Visual Studio 2022 requires that the title being debugged is built with the October 2021 (or newer) Microsoft Game Development Kit (GDK). The dependency on the October 2021 (or newer) Microsoft Game Development Kit (GDK) exists because the Game OS that ships in those versions of the Microsoft Game Development Kit (GDK) contains binaries that are required for debugging with Visual Studio 2022. The following error is displayed if debugging with Visual Studio 2022 is attempted against an older Game OS. Attempting to use the Visual Studio 2022 debugger against a Game OS older than the version shipped in the March 2022 GDK
Debugging packaged builds

In releases of the XBOX One Software Development Kit, the workflow for debugging packaged builds involved using the Debug Installed App Packages menu item in Visual Studio. This workflow has been significantly simplified in the September 2019 release of the Microsoft Game Development Kit (GDK) as described in this section.
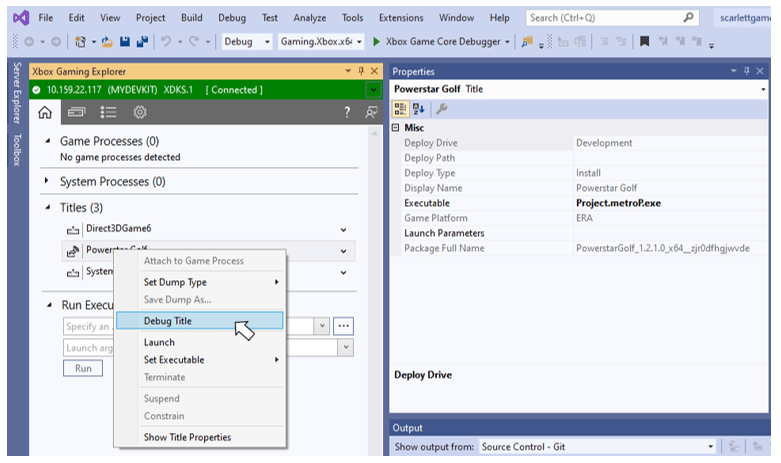
The context menu options in the XBOX Gaming Explorer for launching a title under the debugger or attaching to a running title work equally well for packaged builds as they do for loose file deployments. Streaming install packages are identified by the Install deployment type and icon in the XBOX Gaming Explorer as shown in the following screenshot. Screenshot of the XBOX Gaming Explorer in Visual Studio, showing the highlighted Debug Title menu item from the drop-down menu of a packaged build, identified by the title's icon in the Titles list, for the current console

Debugging transitions between Game Lifecycle states

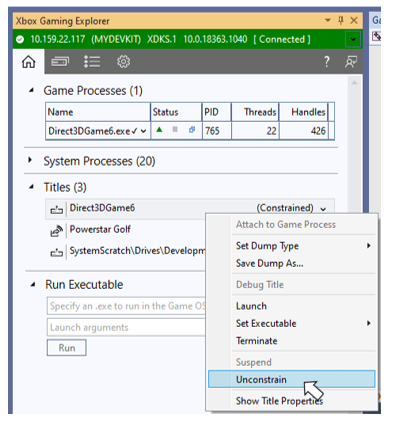
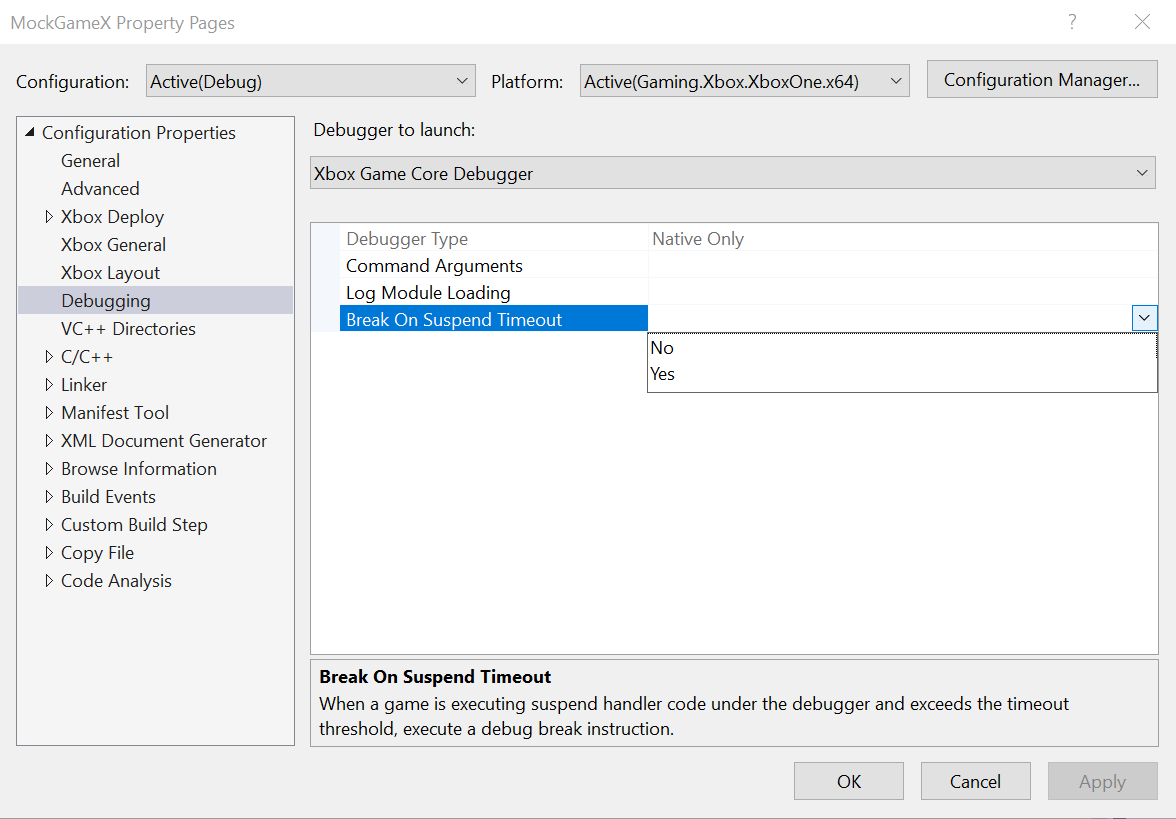
Properly supporting Game Lifecycle requires you to write event handlers for the transitions between the full, suspended and constrained lifecycle states. Visual Studio provides several features to help you write the robust event handlers required for your title to successfully pass through the Game Lifecycle state transitions. The context menus in XBOX Gaming Explorer include options to Suspend, Resume and Constrain your title so you can debug your handlers on a dev kit. Screenshot of the XBOX Gaming Explorer in Visual Studio, showing the highlighted Unconstrain menu item from the context menu of a title in the Constrained state for the current console. Note that you can also manually trigger these state transitions from XBOX Manager and the xbApp command line tool. Regardless of how a state transition is triggered, diagnostic messages describing the transition, along with any failures, are visible in xbWatson and in the XBOX System Monitor window within Visual Studio. In a retail environment, handlers for the Suspend event must complete in less than 1 second, or the system will terminate your title. This suspend time limit clearly shouldn’t always be enforced on development kits or debugging a Suspend handler would be near impossible. By default, when the Visual Studio debugger (or another other user mode debugger) is attached, the 1 second suspend timeout is disabled, allowing you to take the time needed to complete your debugging task. The Visual Studio debugger can also be configured to re-enable the suspend timeout when attached. In this mode, if your Suspend handler doesn’t complete within the 1 second limit, the debugger will force a break so you can see where you were in your Suspend handler when the time limit expired. Running with the debugger in this mode is helpful to get a sense of how often your Suspend handler exceeds the time limit and why. Set the Break On Suspend Timeout property in Visual Studio to put the debugger in a mode in which the suspend timeout is enabled. The debug break that occurs in this mode is done on a new thread that the debugger injects into the process. Navigate to the thread that contains the Suspend handler to begin debugging. Break On Suspend Timeout property If a debugger is not attached to your title when a suspend timeout occurs, the system will create a quiesce crash dump. These dumps can be accessed using the Memory Dump panel in xbWatson.
C++ Dynamic Debugging in Visual Studio 2022

C++ Dynamic Debugging is a new debugging feature that offers a full debugging experience for optimized code without compromising performance. Place deoptimized breakpoints and step in anywhere with on-demand function deoptimization. To activate C++ Dynamic Debugging: Right-click on your project, Properties > Configuration Properties > Advanced > Advanced Properties > Use C++ Dynamic Debugging (preview). Version 17.14 Preview 2 or newer of Visual Studio 2022 is required to use the dynamic debugging feature. Goto https://aka.ms/dynamicdebugging to learn more.
The version of Visual Studio required to use C++ Dynamic Debugging (version 17.14) is scheduled to release after the April 2025 GDK. After version 17.14 of Visual Studio releases, a GDK update will be released that contains the C++ debug monitor (msvsmon.exe) required for C++ Dynamic Debugging. If you wish to use C++ Dynamic Debugging before that GDK update is released, contact your Microsoft account manager for instructions describing how to load the appropriate version of the C++ debug monitor onto your console.

See also

XBOX Gaming Explorer Visual Studio
Last modified on August 20, 2026