
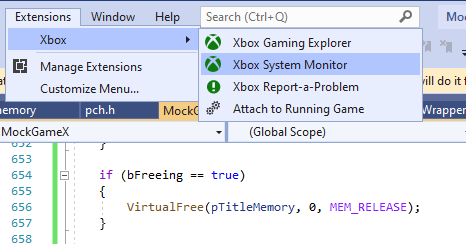
This topic describes the XBOX System Monitor tool window, a tool window that the Microsoft Game Development Kit (GDK) installs into the Visual Studio shell. The system monitor is a performance monitoring and diagnostic window consisting of two tabs. The first tab, Memory (CPU), presents a Task Manager-like view that shows the state of the console that the system monitor is connected to (and that’s currently selected in XBOX Gaming Explorer). The Memory (CPU) tab is focused on title and tooling memory consumption. The second tab, Console Monitor displays tracing data from the OutputDebugString API and from console game diagnostic events. As shown in the following screenshot, you can access XBOX System Monitor by selecting the XBOX Extensions menu in Visual Studio.

Memory (CPU)

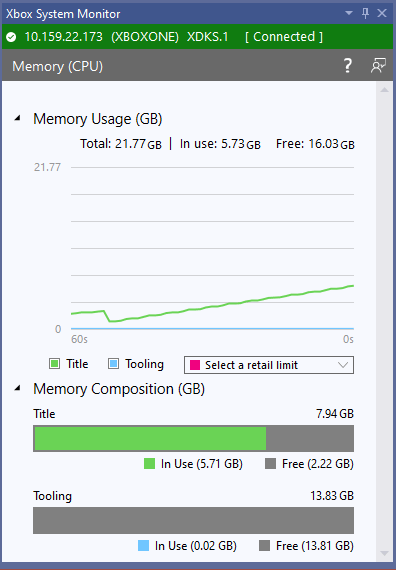
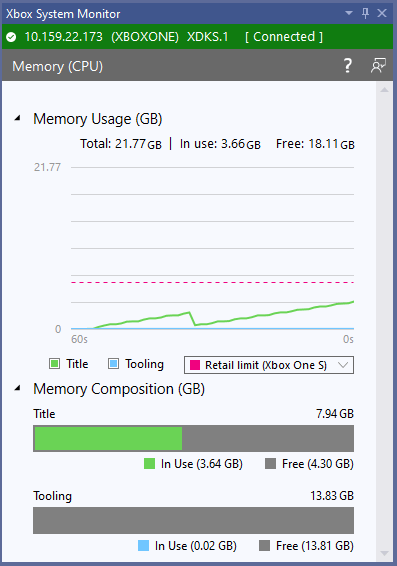
The Memory (CPU) tab displays the amount of title and tooling memory that’s currently in use on the console, in both a line graph and in a set of bar charts. The following screenshot shows a title that uses very little tooling memory, but the title also uses a slowly growing amount of title memory. If you’re developing a title that will run on multiple members of the XBOX One family, it’s useful to know how close your title is to the retail memory limit of each console type. In the graph in the screenshot, the range of values that are displayed on the y-axis varies with the type of console that the system monitor is connected to. For example, the maximum y-value is greater on an XBOX Series X Dev Kit than on an XBOX One Dev Kit. You can select the Retail Limits drop-down to see a list of consoles and their retail memory limits. If you select the checkbox next to a console type, you see a horizontal line drawn on the graph that represents that console’s retail memory limit. The following screenshot shows a title that’s close to the retail memory limit of an XBOX One S console. For more information about the amount of title memory that’s available on each console type, see Configuring memory for your title and dev kit. For a description of the tools for performing a deeper analysis of how your title is using memory, see Analyzing memory usage and performance. For more information about the tools that are provided by PIX, see PIX.
Console Monitor

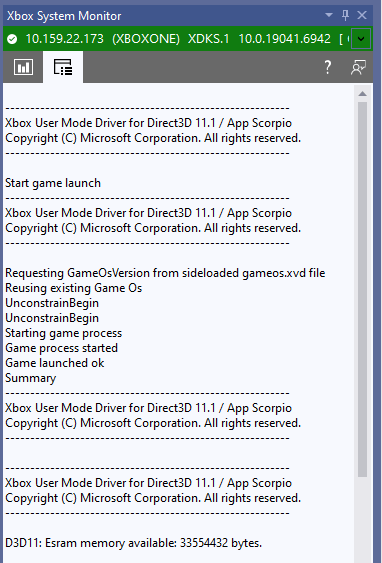
The Console Monitor tab displays a subset of the console tracing that is currently displayed in xbWatson. The tracing displayed includes the strings passed to the OutputDebugString API, and from console game diagnostic events. The OutputDebugString data includes the data from both your title and from the system itself.
See also

Visual Studio XBOX Gaming Explorer Analyzing memory usage and performance
Last modified on August 20, 2026