
Daily Content Usage report
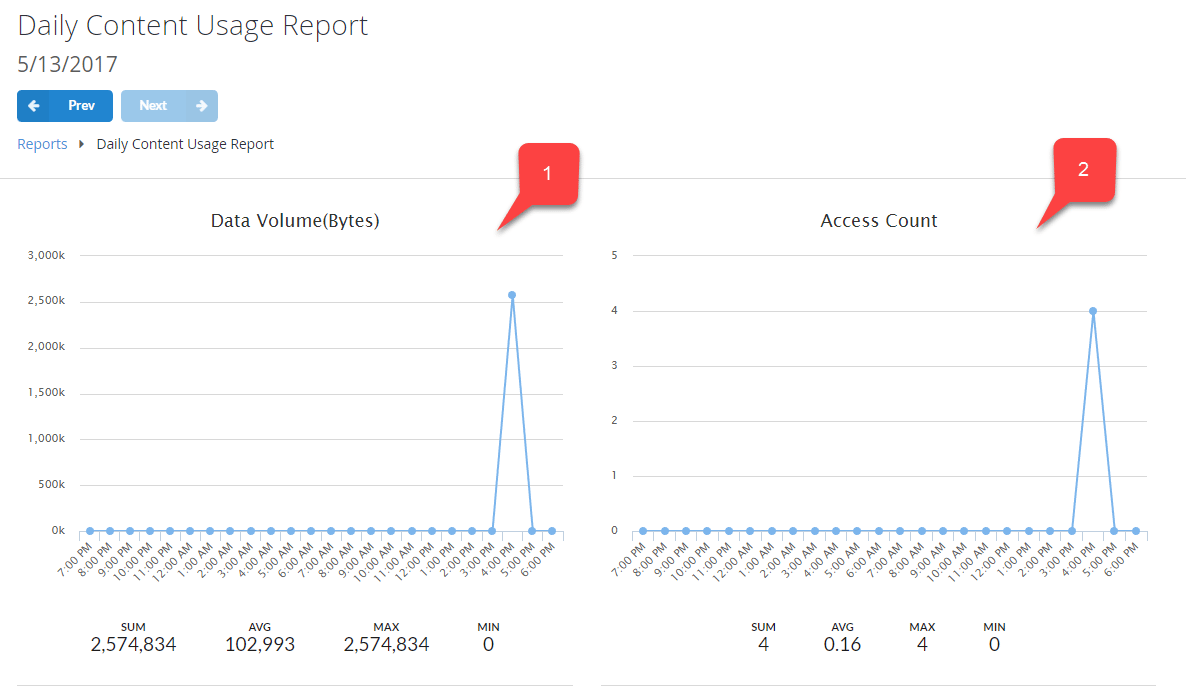
The CDN Usage report contains two graphs displaying content usage over a 24 hour period:- The Data Volume graph illustrates the distribution of transferred bytes.
- The Access Count graph shows the distribution of content downloads over a specified period of time.
Monthly Content Usage Summary report
This report summarizes monthly content usage. The table within it contains the amount of content bytes transferred, as well as the total number of downloads during a specified month.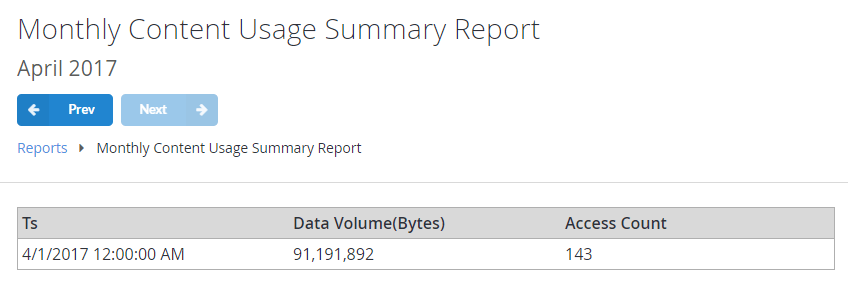
Populating Content Usage reports
The code in the template shown below may be used to introduce some data for the reports.How to work with report charts
PlayFab report charts all follow the same model:- In the top area of the page, you usually get a Control Panel. This contains a report name, observed time period, and Prev/Next buttons to switch between the time periods.
- The Chart Panel area shows the available data as a chart, where the horizontal axis corresponds to the time flow, and the vertical axis corresponds to the number of relevant instances - such as API calls, purchases, users, and so on, depending on the report type.
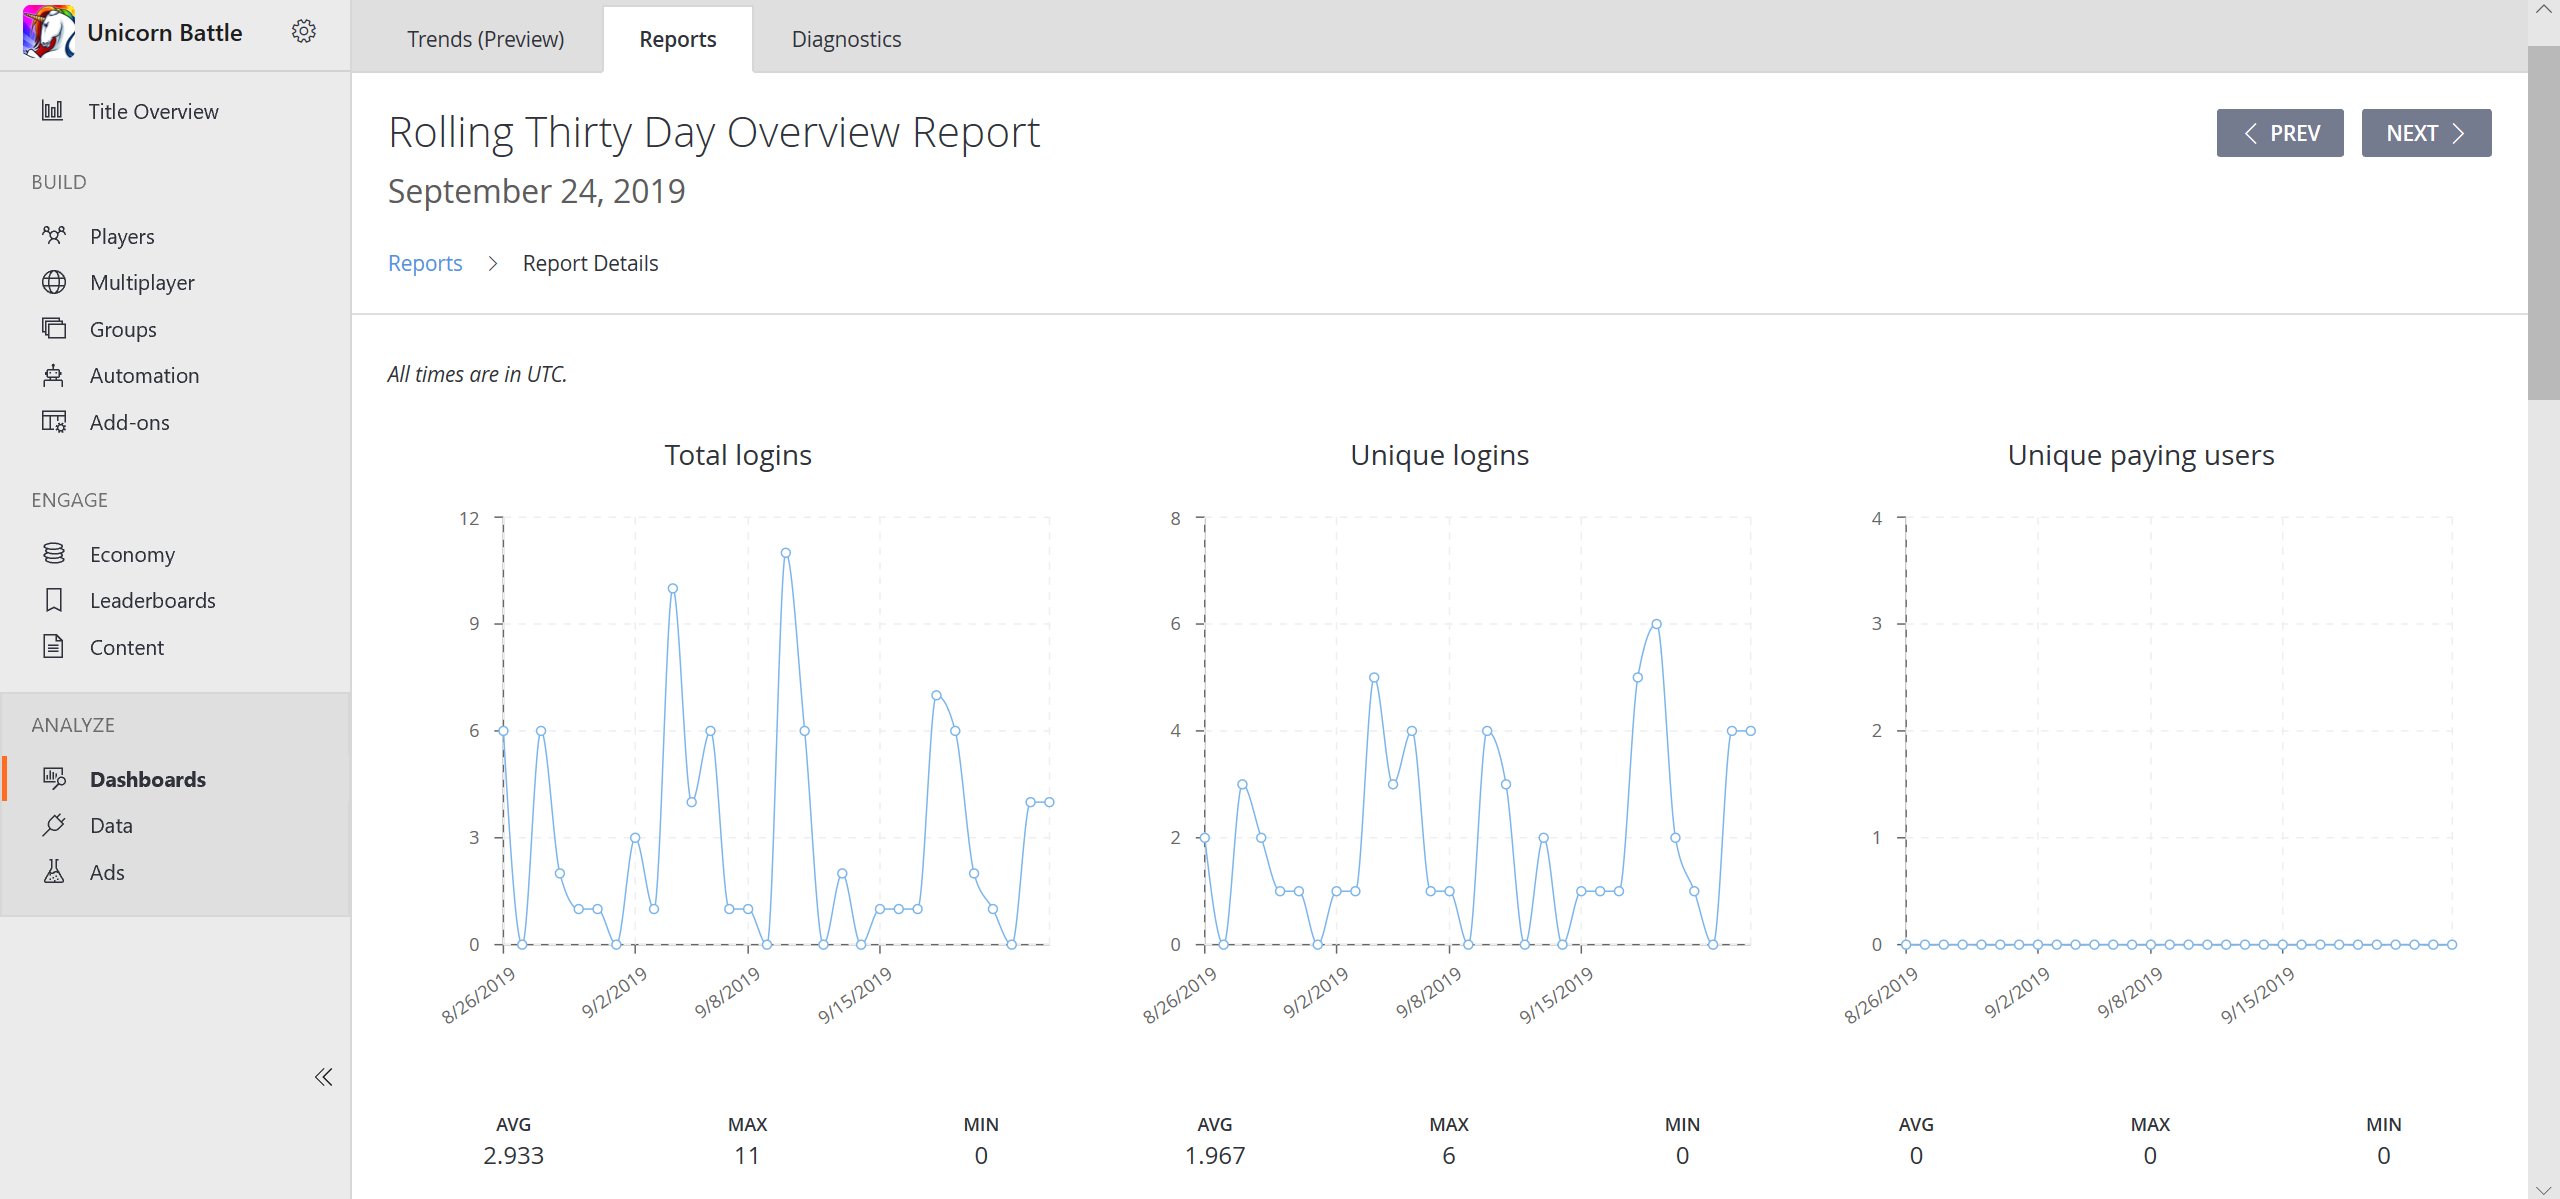
- The metrics available in the Timeline area contain the sum of all the instance across the time period (SUM), the average number of instances through all the timestamps (AVG), the peak value (MAX), and the lowest value (MIN).