Hardware
Various independent hardware vendors (IHVs) define heterogeneous CPU topologies differently. Intel and Qualcomm use the terms Performance and Efficiency, while AMD uses the terms Performance and Compact. Each vendor makes trade-offs between performance and efficiency when designing its core topology. The following examples illustrate some of the design choices involved:- Different cache sizes
- The different cores might have different cache sizes.
- For example, the performant cores might have larger L1 and L2 caches.
- Cache sharing
- There can be diverse levels of sharing of the caches between cores.
- For example, higher-performance cores might each have a private L2 cache, while more efficient cores might share a single L2 cache.
- Support for symmetric multi-threading (SMT)
- Some cores might support SMT while other cores don’t.
- Intel refers to SMT as Hyper-Threading.
- Internal core layout
- The internal resources of the various core types might be different.
- For example, the performant cores might include more floating-point pipes, ALU pipes, or wider data lanes.
- Maximum frequency
- The maximum frequency between the core types could be different.
- For example, the performant cores might be able to achieve a higher frequency than the efficient cores.
Performance numbers
You expect cores at different efficiency levels to perform differently. One core is designed for performance and the other is designed for power savings. The question is how different are the cores. The data shown is a conglomeration across IHVs. Each IHV has different scaling for each test based on the choices they made for their topology. While the exact numbers are different, the patterns are similar across all IHVs. Also, each CPU generation makes different tradeoffs, which adjusts their relative numbers. Creating numbers across all existing IHVs and generations is beyond the scope of this article.Synthetic tests
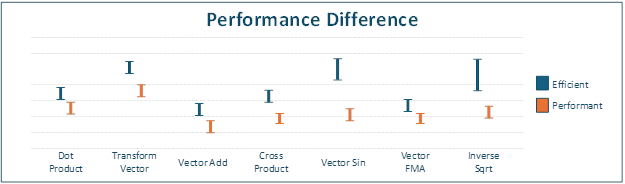
Vector math is a major part of the work a game title does within a frame. This workload could be anything from physics to AI to rendering. The game performs this work by using vector types with three or four floats that fit within a single 128-bit SSE register. They cross a wide range of operations such as dot products, matrix multiplication, square-root calculations, and vector transforms. Performance differences in these operations can have a significant effect on the overall frame time. The following graphs show the relative cost of performing seven common math operations. The measurements use a vector of four 32-bit floating-point values stored in a single 128-bit SSE register. A matrix is made up of four vectors, for a total of sixteen 32-bit floating-point values across four 128-bit SSE registers. These operations were selected because they’re commonly used within a frame.- Dot product: Compute the dot product for a vector.
- Transform vector: Transform a vector by multiplying it with a matrix.
- Vector add: Add two vectors together.
- Cross product: Calculate the cross product of two vectors.
- Vector sine: Calculate an approximation of the sine for each element in a vector.
- Vector FMA (fused multiply-add): Multiply two vectors and add a third.
- Inverse square root: Compute the inverse square root of a vector’s length.
Real world
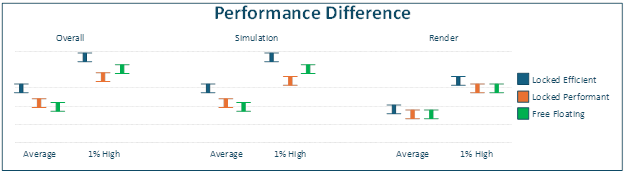
The earlier numbers show specific benchmarks in isolation and they only tell part of the story. The following numbers come from benchmarks of an AAA game engine that uses two main threads (Simulation and Render) with a set of job threads. The benchmark uses three test configurations.- The two main threads run only on the higher-performance cores.
- The two main threads run only on the efficient cores.
- The two main threads run on all cores in the system.
Each manufacturer can adjust these scheduler heuristics to tailor them to their hardware. For example, AMD has their Workload Profile Scheduling and Intel has their Thread Director technology. Each IHV also tends to tweak the heuristics to match the specific topology of the SoC.
Recommendations
Thread affinity
The advice for thread affinity when running on a desktop machine with only a single efficiency class is to avoid setting hard thread affinities and instead let threads float across all cores. The main reason for this uncertainty is that it’s unknown what other processes might be running on a user’s machine ahead of time. It’s possible for a thread with a hard affinity to end up sharing a core with another high priority thread in the system. The net effect is that the title thread is starved for execution. If this contention occurs on a frame-critical thread, the title can experience inconsistent frame times. You want to make sure the OS has a place to move title threads to keep them running. However, this advice needs to change when running on heterogeneous CPUs. The main reason is that the OS doesn’t necessarily know which of the title’s threads or jobs are frame critical. It has some heuristics to determine what it thinks are the frame critical threads, but those heuristics can still make incorrect choices. It might decide to move one of those threads or jobs to a lower performing core and thus create a higher likelihood of performance issues in the title. The recommendation is to target allowing the title threads to run at a minimum on three to four cores and more is preferred. For instance, on a lower end system that has one higher performance core and three lower performance cores you should allow the threads to float across all the cores. On machines with three or more performance cores, you could restrict the frame critical threads to only those higher performance cores. On higher end machines with many cores that also support SMT, some titles might try to lock their threads to physical cores. This technique avoids contention at the physical core level as several high priority threads share the same resources of a physical core. In general, though it isn’t recommended to consider this case. The OS already applies this behavior system-wide. It schedules threads across physical cores first and uses more logical cores only when necessary. The only case a title should consider is when there are enough higher performance cores in the system to support the titles’ critical threads. In this case, it might be desirable to lock the frame critical threads to higher performing cores. However, those threads should be allowed to float across all the higher performing cores. While in some cases allowing all threads to float across all cores can improve performance, this behavior isn’t consistent across all CPU manufacturers. If the title implements a work stealing system that can fully balance the workload across all threads, then any job thread should be allowed to float across all the cores. It doesn’t matter if they’re high priority or low priority job threads. The work stealing algorithm automatically balances the load and allows the most work to complete in the shortest amount of time. Threads on the higher performing cores execute more jobs during the frame. If there are multiple frame critical threads, it can be useful to set their affinity such that no two frame critical threads can run on the same core. For instance, if there are two frame critical threads then setting their affinity to be an exclusive or of each other removes the possibility of the OS causing the threads to contend with each other. Again though, only consider this option if there are enough cores to support this case while still allowing each frame critical thread to float across a minimum of three to four cores.Thread topology
When considering how to assign work to threads in a heterogeneous environment, the primary data revolves around the length of the various tasks and how they interact with each other. What is the average length of each task, what are the dependencies between the tasks, what are the priorities of each task, etc. How much can the job threads absorb spikes in time on any critical threads or jobs? If one of those threads or jobs runs 35 percent slower, how much does that affect frame time? For example, if a task runs long how much does this delay affect the rest of the frame, does the system stall until that task is completed? It can be useful to determine how much a heterogeneous system affects frame time by adding extra overhead in the critical threads or jobs. As a test, randomly make a job or block of work take an extra 25%-35% of time. The degree of change in overall frame time indicates how well the job system can absorb execution spikes. The ideal situation is that the frame times have almost no change. It means the system can absorb arbitrary spikes in frame time. The spikes come from either running on a lower performant core or from another random process in the system using CPU time.Thread communication
Some thought should be taken with thread communication using locking primitives. The overhead of a context switch is tightly coupled with the C-State of the receiver core before the new thread starts running. The core needs to be in C0, the running state, before the new thread can start running. The cheapest is when the core was already running, it’s already in C0. However, if the core is idle, it is in a lower C-State. The level of the C-State corresponds to deeper levels of sleep. A deeper sleep results in less power being used by the core. However, it’s more expensive to wake up and start running again from a deeper sleep. The most common low-power C-state is C1, which can add an overhead from 2-7 μs. The next C-state, C2, can add an overhead of approximately 40-100 μs. The exact number is IHV and SoC specific. There are many variables that control what C-State a core is in when idle, it’s a balance between responsiveness and power usage. A lower C-State uses less power than a higher C-State. It’s common to have a core first enter C1, then switch to C2 if it hasn’t been running code for a while. There’s another concern, what happens when the thread submitting the job and the thread executing the job are on cores with a different performance profile. Technically it’s possible for the job thread to complete jobs faster than new jobs are being created. This situation is more likely to happen if the thread executing the job is on a faster core than the thread submitting the jobs. If a job takes less time to execute than it does to be created, the title can get into a situation where a job thread is constantly suspending waiting for new jobs. The net effect is that jobs become more expensive to execute as the job thread is constantly suspending. The overhead cost of a context switch is added to the time for each job to execute. This overhead can paradoxically lead to lower frame rates when running on more performant cores. For instance, work that used to take 250 μs can suddenly start taking 275 μs, this regression is a 10% drop in performance. Because of this case, the recommendation is that jobs are instead submitted in batches as opposed to as they’re created. For instance, if the system follows a pattern where it builds a job, submits the job, builds a job, submits a job, etc. This pattern should be adjusted to instead perform a batch of builds first and then submit them all at the same time. If the title is using an object that requires WaitForSingleObject then it should be placed within a small spin loop. Call the function with a timeout of 0, once the spin is done use the title’s normal timeout value. The best solution for this problem though is to use modern sync APIs like Slim Reader/Writer (SRW) Locks, Critical Sections, and WaitOnAddress. These sync APIs all include some form of spin internally, which can keep a thread from constantly suspending. This spin is especially useful for locks that are held for a short amount of time. It’s important to avoid long spin locks. For instance, having a pattern where threads constantly spin waiting for work to perform. If there’s other work that needs to be performed on the core the scheduler will eventually suspend the spinning thread to perform this work. When this preemption occurs, there’s a high likelihood that the suspended thread remains suspended for a significant amount of time. This behavior is all done to prevent starvation of other threads. Since the title has little control over when suspension happens, it can lead to stutters in frame rate.Job systems
For best performance, structure the engine around jobs rather than relying on dedicated, long-running frame critical threads. For example, a Simulation/Render thread model creates two persistent frame critical threads. However, lengthy jobs can cause any job thread to behave as a frame critical thread. If a job takes 10 ms, the thread executing it becomes frame critical for that period, regardless of its original role.Work stealing
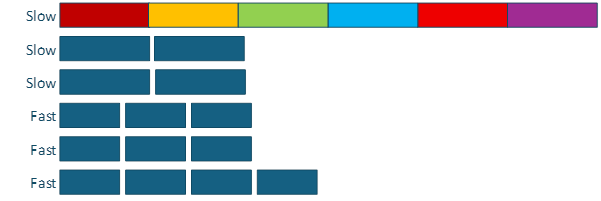
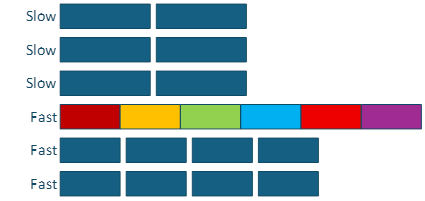
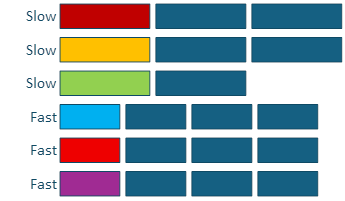
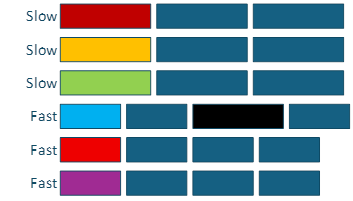
The number one recommendation is to use work stealing across the entire job system and let any frame critical threads take part in the work stealing algorithm. For example, if the render thread is waiting for render related jobs to complete it should execute some of those jobs. This behavior is already common practice in many game engines. However, it’s worth mentioning here because this type of behavior is critical for the game engine to be able to absorb frame spikes due to heterogeneous cores and possible OS preemption. When a job takes longer to execute, it increases the risk of a frame-time spike. This behavior could be caused by either the job running on a lower performing core, or other work within the PC. The recommendation is that the engine should aim for a job taking about two percent of the frame. This budget means, for example, no more than about 333 μs for a game running at 60 fps. If needed multiple smaller jobs should be batched into a larger job to aim for the two percent number. This approach provides a good tradeoff between job size, thread communication, and the ability to absorb spikes. These examples show the effects that long frame-critical jobs can have on system performance. In these examples, each job consists of the same number of operations. In this example a single job that takes 375 μs on a slow core and 250 μs on a fast core. The long pole job is 6x more expensive than the other jobs. The worst-case situation is when the long pole job ends up on one of the slow cores. This can have a drastic effect on frame times. In this scenario, the total time to execute the work is 2,250 μs, six times 375 μs. Figure 3: Long pole example running on a slower core.