> ## Documentation Index
> Fetch the complete documentation index at: https://devdocs.xbox.com/llms.txt
> Use this file to discover all available pages before exploring further.
# 指令追蹤擷取
> 指令追蹤擷取
* [概觀](#itrace_overview)
* [擷取程序](#itrace_take_capture)
* [指令追蹤版面配置](#itrace_views)
* [Capture Summary](#itrace_summary_view)
* [Instruction Table](#itrace_instruction_table_view)
* [Source](#itrace_source_view)
* [Callgraph](#itrace_callgraph_view)
* [Memory Regions](#itrace_memory_regions_view)
* [Memory Region Details](#itrace_memory_region_details_view)
* [最佳做法與限制](#itrace_limitations)
## 概觀
指令追蹤擷取可協助您最佳化遊戲對主機記憶體與指令快取的使用。PIX 會記錄擷取執行期間所執行之每個 CPU 指令的資料。接著會使用快取模擬分析所有記憶體載入與儲存指令。模擬結果可用來:
* 識別哪些函式造成最多快取遺漏,以及將最多資料載入快取。也會識別造成快取遺漏的特定 C++ 原始程式碼行與組譯指令。
* 檢視每個 CPU 核心與模組的快取命中與遺漏統計資料。
* 以視覺方式呈現每個快取行的使用效率。指令追蹤擷取會顯示快取行中有哪些位元組被存取,以及存取每個位元組的程式碼。也會提供資料結構資訊,協助您最佳化資料配置,以充分利用記憶體快取。
除了記憶體快取分析功能之外,指令追蹤擷取也可協助您識別與從寫入合併記憶體讀取,或存取其他執行緒之堆疊相關的潛在效率不彰或缺陷。
## 進行擷取
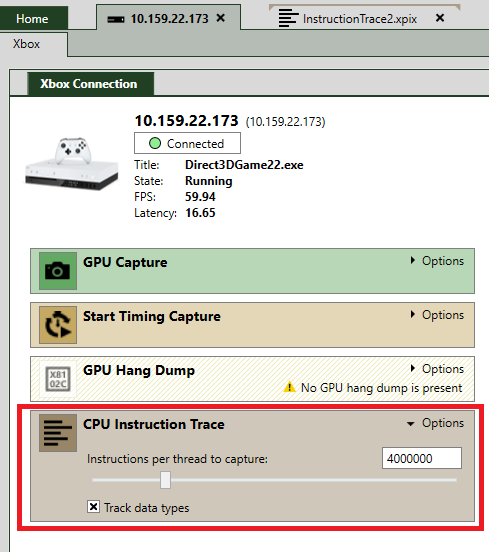
指令追蹤會從擷取開始時起,記錄指定數目之 CPU 指令的資料。要擷取的指令數目,是在開始擷取之前,使用 **CPU Instruction Trace Options** 窗格上的 **Instructions per thread to capture** 欄位指定。請注意,您指定的指令數目會針對遊戲處理程序中執行的每個執行緒進行擷取。PIX 也可以選擇性地記錄每個原始程式碼行與組譯指令所存取之資料類型的相關資訊。選取 **Track Data Types** 核取方塊,即可在擷取中新增資料類型資訊。
指定指令數目與類型追蹤選項後,選取 **Capture** 按鈕即可開始擷取。
 ## 指令追蹤版面配置
* [Summary](#itrace_summary_view)。提供遊戲與主機中資料快取及指令快取互動方式的摘要。
* [Instruction Table](#itrace_instruction_table_view)。顯示針對指定函式執行的 CPU 指令。也會提供所存取之資料類型,以及哪些組譯指令造成資料快取遺漏的資訊。
* [Source](#itrace_source_view)。顯示指定函式的 C++ 原始程式碼。也會提供所存取之資料類型,以及哪些原始程式碼行造成資料快取遺漏的資訊。
* [Callgraph](#itrace_callgraph_view)。顯示擷取期間執行之所有函式的呼叫圖。此檢視可用來檢查每次呼叫的各種統計資料,包括快取遺漏次數、依指令類型的細分等。也提供函式蝴蝶檢視,可用來瀏覽指定函式的呼叫端與被呼叫端。
* [Memory Regions](#itrace_memory_regions_view)。提供一組位址範圍之記憶體存取模式的詳細資料。
* [Memory Region Details](#itrace_memory_region_details_view)。顯示存取目前所選區域中記憶體的 C++ 原始程式碼行與組譯指令,以提供更進一步的快取行分析。
### Capture Summary
指令追蹤擷取開啟時會顯示摘要版面配置,提供遊戲與系統中記憶體快取及指令快取互動方式的分析。也會提供警告,例如從寫入合併記憶體讀取。
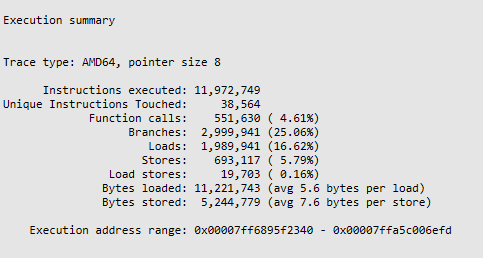
摘要頁面的 *Execution Summary* 區段會顯示擷取的一些基本統計資料,包括依類型細分的指令,以及載入與儲存的資料量。
## 指令追蹤版面配置
* [Summary](#itrace_summary_view)。提供遊戲與主機中資料快取及指令快取互動方式的摘要。
* [Instruction Table](#itrace_instruction_table_view)。顯示針對指定函式執行的 CPU 指令。也會提供所存取之資料類型,以及哪些組譯指令造成資料快取遺漏的資訊。
* [Source](#itrace_source_view)。顯示指定函式的 C++ 原始程式碼。也會提供所存取之資料類型,以及哪些原始程式碼行造成資料快取遺漏的資訊。
* [Callgraph](#itrace_callgraph_view)。顯示擷取期間執行之所有函式的呼叫圖。此檢視可用來檢查每次呼叫的各種統計資料,包括快取遺漏次數、依指令類型的細分等。也提供函式蝴蝶檢視,可用來瀏覽指定函式的呼叫端與被呼叫端。
* [Memory Regions](#itrace_memory_regions_view)。提供一組位址範圍之記憶體存取模式的詳細資料。
* [Memory Region Details](#itrace_memory_region_details_view)。顯示存取目前所選區域中記憶體的 C++ 原始程式碼行與組譯指令,以提供更進一步的快取行分析。
### Capture Summary
指令追蹤擷取開啟時會顯示摘要版面配置,提供遊戲與系統中記憶體快取及指令快取互動方式的分析。也會提供警告,例如從寫入合併記憶體讀取。
摘要頁面的 *Execution Summary* 區段會顯示擷取的一些基本統計資料,包括依類型細分的指令,以及載入與儲存的資料量。
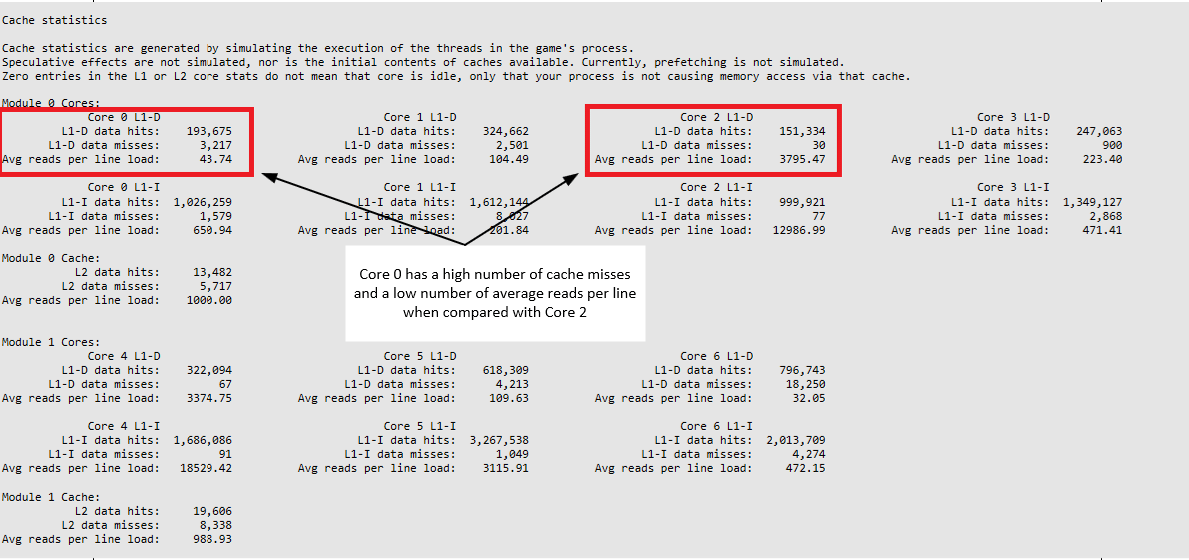
 摘要頁面的 *Cache Statistics* 區段會顯示主機中資料快取與指令快取的統計資料。會提供快取命中次數、快取遺漏次數,以及每個快取行被讀取的平均次數。這些數字可用來大致了解在某個核心上執行的程式碼,與在另一個核心上執行的程式碼相比,在快取效率方面的表現。例如,在下圖中,核心 0 的 L1-D 資料遺漏率與核心 2 相比相對較高 (3,127 對 30)。快取統計資料也顯示,與核心 2 相比,核心 0 上快取行載入快取後被讀取的次數相對較低 (約 43 對約 3795)。大量的資料遺漏加上較低的平均快取行讀取次數,可能表示快取使用效率不彰。
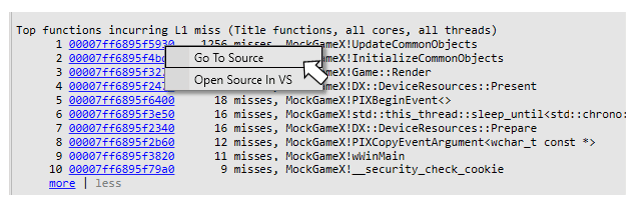
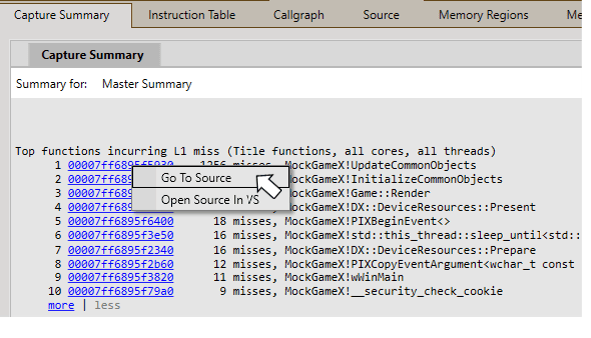
 指令追蹤摘要分析包括造成 L1 與 L2 遺漏的前幾名函式清單。當擷取是針對 XBOX Series X 開發套件或 XBOX Series S 測試套件進行時,也會提供 L3 遺漏。按一下清單中函式旁的超連結,會瀏覽至 [**Instruction Table**](#itrace_instruction_table_view) 版面配置,顯示該函式執行時所執行的組譯指令集合,以及描述哪些指令造成快取遺漏的附註。以滑鼠右鍵按一下函式旁的超連結,會開啟操作功能表,可用來透過 [**Source**](#itrace_source_view) 版面配置檢視該函式的原始程式碼,或在 Visual Studio 中開啟原始程式檔。
 **Summary** 檢視的 *Cache Line Statistics* 區段包括每個快取行使用情況的分析,以位元組與百分比表示。這些數字越高,表示您的資料結構配置越有效率,進而使快取行的使用更有效率。下列範例顯示,載入資料快取的資料中約有 74% 被存取 (每個 64 位元組快取行中約 47 個位元組)。
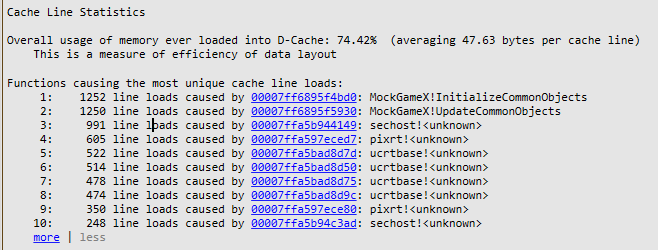 也會提供造成最多快取行載入的函式清單,以及讀取與寫入最多快取行的函式集合。
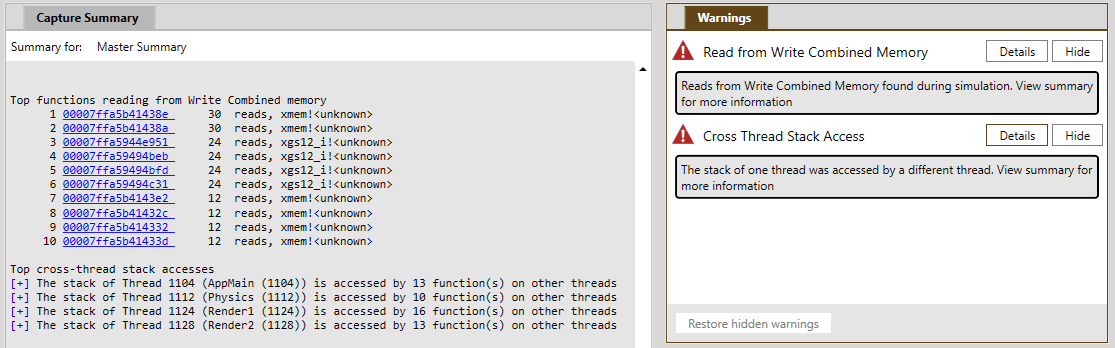
除了快取行使用情況的分析之外,**Summary** 檢視也會提供其他潛在效能與可靠性問題的資訊。這些問題包括使用寫入合併記憶體,以及執行緒存取其他執行緒之堆疊的情況。預設版面配置右上角的 *Warnings* 檢視會指出這些問題何時發生。*Capture Summary* 檢視會提供更多詳細資料,包括這些問題發生時的呼叫堆疊。
也會提供造成最多快取行載入的函式清單,以及讀取與寫入最多快取行的函式集合。
除了快取行使用情況的分析之外,**Summary** 檢視也會提供其他潛在效能與可靠性問題的資訊。這些問題包括使用寫入合併記憶體,以及執行緒存取其他執行緒之堆疊的情況。預設版面配置右上角的 *Warnings* 檢視會指出這些問題何時發生。*Capture Summary* 檢視會提供更多詳細資料,包括這些問題發生時的呼叫堆疊。
 ### Instruction Table
**Instruction Table** 版面配置可用來檢查針對指定函式所執行的 CPU 指令集合。會為每個執行的指令提供執行次數與快取遺漏次數。如果開始擷取之前選取了 *Track Data Types* 選項,也會顯示每個指令所存取的資料類型。通常是透過按一下 [**Summary**](#itrace_summary_view) 版面配置中函式旁的超連結,瀏覽至 **Instruction Table** 版面配置。
### Instruction Table
**Instruction Table** 版面配置可用來檢查針對指定函式所執行的 CPU 指令集合。會為每個執行的指令提供執行次數與快取遺漏次數。如果開始擷取之前選取了 *Track Data Types* 選項,也會顯示每個指令所存取的資料類型。通常是透過按一下 [**Summary**](#itrace_summary_view) 版面配置中函式旁的超連結,瀏覽至 **Instruction Table** 版面配置。
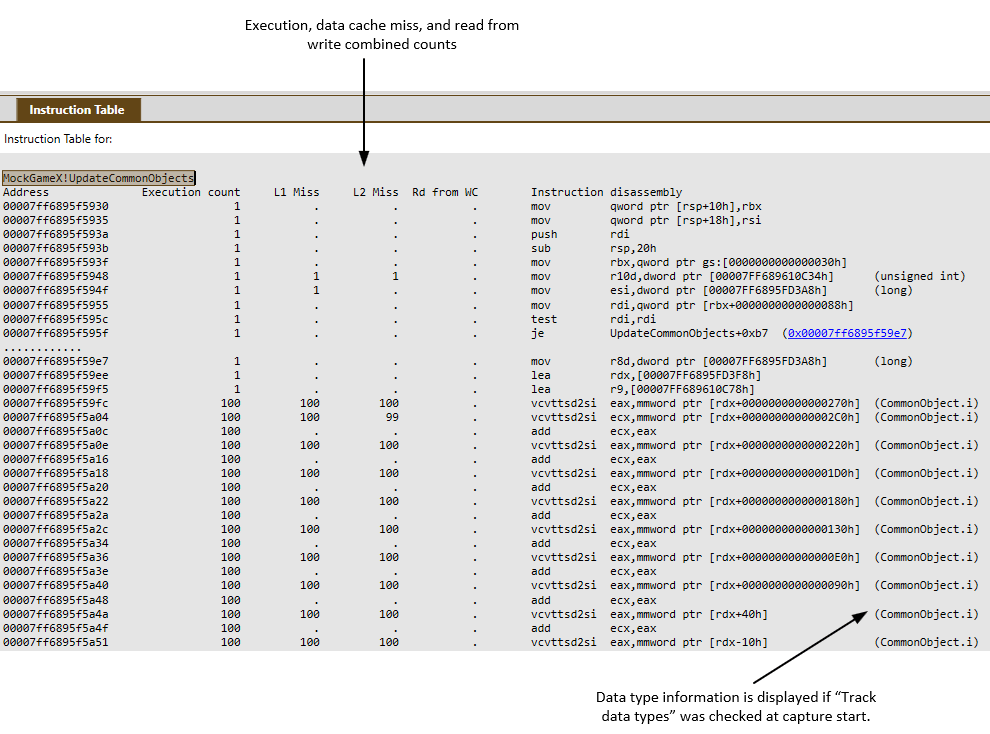 **Instruction Table** 中顯示的指令集合,是函式執行時所執行的指令,而不是函式中的所有指令。具體來說,不會顯示未採用之分支的指令。未執行的指令群組會在位址欄中顯示為一列點。例如,下圖中的 *je* 指令造成跳躍,略過了一些指令,如跳躍後的那一列點所示。
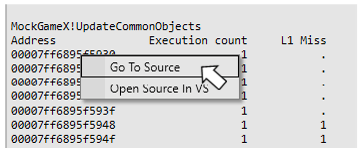
 以滑鼠右鍵按一下位址欄會顯示操作功能表,可用來瀏覽至 [**Source**](#itrace_source_view) 版面配置,或在 Visual Studio 中開啟原始程式檔。
 可以使用 Ctrl+F 按鍵組合開啟搜尋方塊。
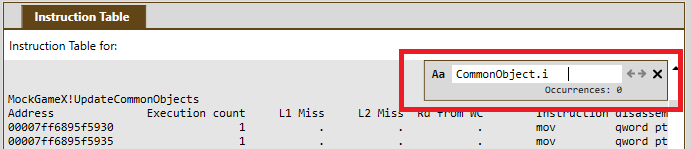 可以從 **Instruction Table** 複製文字並貼到其他工具中,以支援其他分析情境。選取要複製的文字後,使用 Ctrl+C 將文字複製到剪貼簿。可以使用 Ctrl+A 選取 **Instruction Table** 中的所有文字。
### Source
**Source** 版面配置可用來檢查指定函式的 C++ 原始程式碼。通常是透過按一下 [**Summary**](#itrace_summary_view) 版面配置中函式旁的超連結,或在 [**Summary**](#itrace_summary_view) 版面配置或 [**Instruction Table**](#itrace_instruction_table_view) 版面配置中選取 *Goto Source* 操作功能表項目,瀏覽至此版面配置。
可以從 **Instruction Table** 複製文字並貼到其他工具中,以支援其他分析情境。選取要複製的文字後,使用 Ctrl+C 將文字複製到剪貼簿。可以使用 Ctrl+A 選取 **Instruction Table** 中的所有文字。
### Source
**Source** 版面配置可用來檢查指定函式的 C++ 原始程式碼。通常是透過按一下 [**Summary**](#itrace_summary_view) 版面配置中函式旁的超連結,或在 [**Summary**](#itrace_summary_view) 版面配置或 [**Instruction Table**](#itrace_instruction_table_view) 版面配置中選取 *Goto Source* 操作功能表項目,瀏覽至此版面配置。
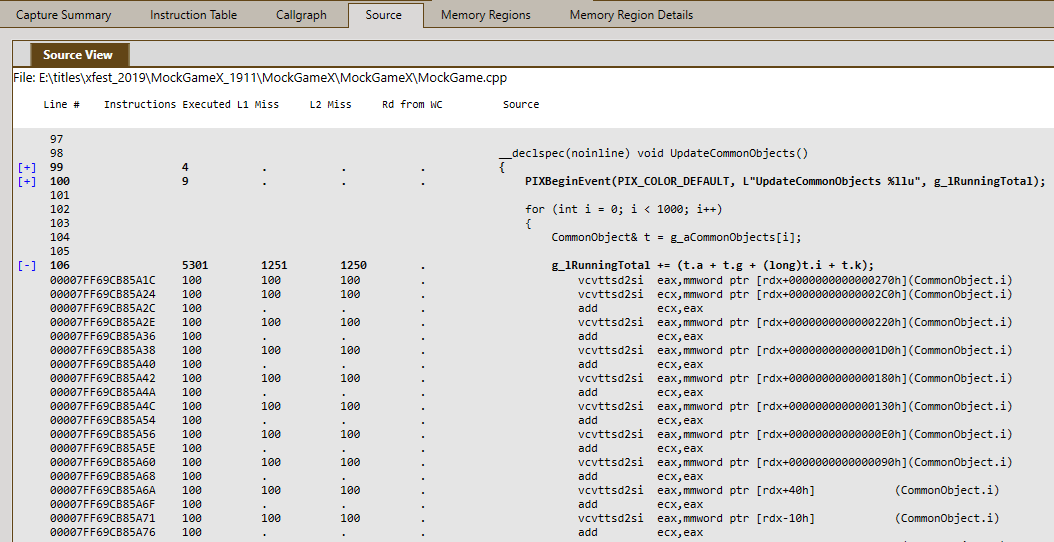
 每個 C++ 原始程式碼行都會附註對應於該行的組合語言指令,以及每個執行之指令的執行次數與快取遺漏次數。如果開始擷取之前選取了 *Track Data Types* 選項,也會顯示每個指令所存取的資料類型。原始程式檔的名稱會顯示在檢視頂端。開啟的原始程式檔是 PDB 中指定的檔案 (包括其路徑)。可以使用展開與摺疊箭號,查看或隱藏與特定原始程式碼行相關聯的所有組譯指令。
 如果找不到 PDB 中指定的 C++ 原始程式檔,原始程式檔名稱旁會顯示訊息,且檢視會改為只顯示組合語言指令。
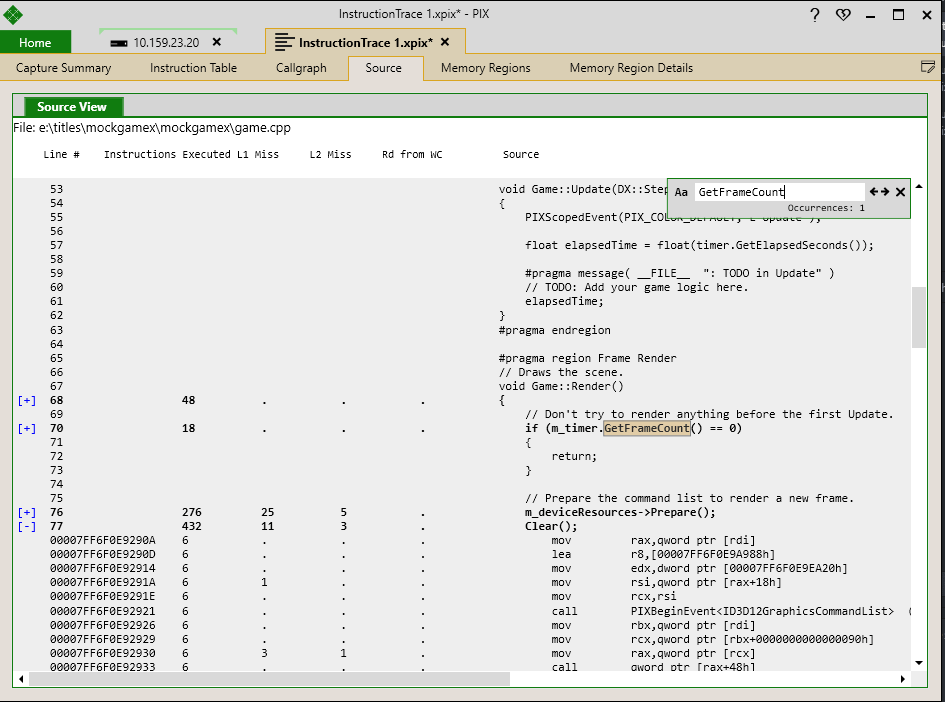
**Source** 檢視也有「Find」功能,可用來在原始程式碼中尋找特定文字,如下圖所示。若要開啟 **Find in Source** 對話方塊,請按 Ctrl+F。若要尋找文字的下一個出現位置,請按 F3。
如果找不到 PDB 中指定的 C++ 原始程式檔,原始程式檔名稱旁會顯示訊息,且檢視會改為只顯示組合語言指令。
**Source** 檢視也有「Find」功能,可用來在原始程式碼中尋找特定文字,如下圖所示。若要開啟 **Find in Source** 對話方塊,請按 Ctrl+F。若要尋找文字的下一個出現位置,請按 F3。
 可以從 **Source** 檢視複製文字並貼到其他工具中,以支援其他分析情境。選取要複製的文字後,使用 Ctrl+C 將文字複製到剪貼簿。可以使用 Ctrl+A 選取 **Source** 檢視中的所有文字。
### Callgraph
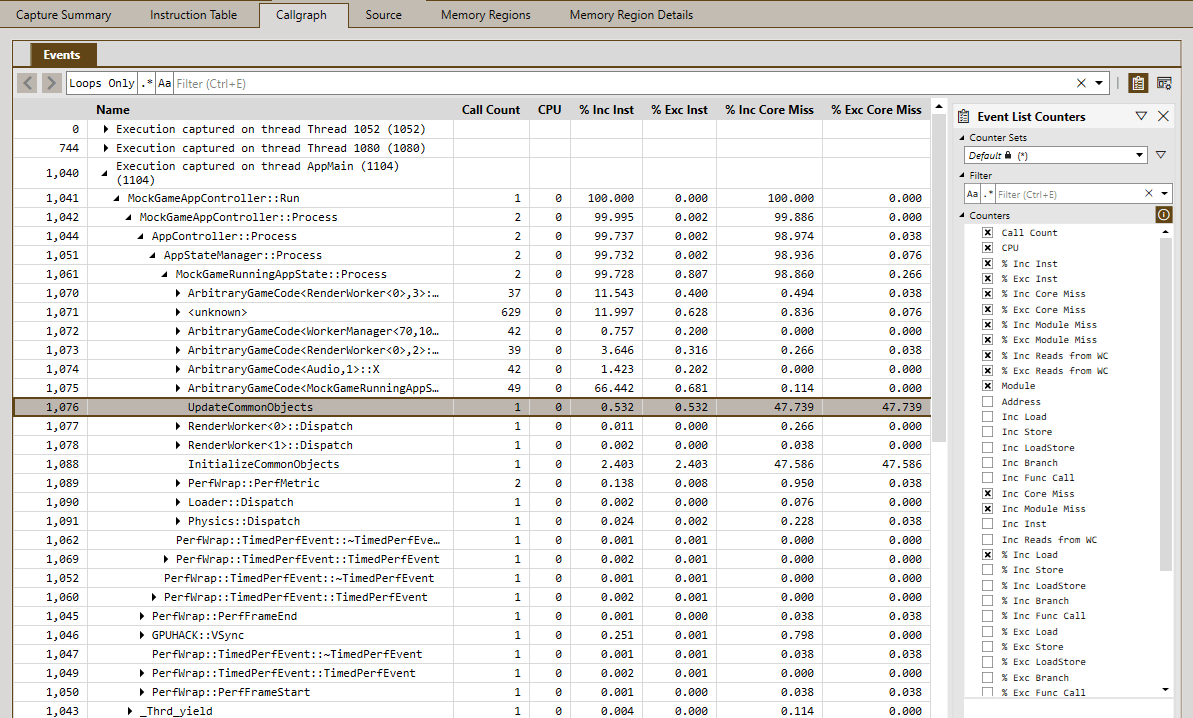
指令追蹤包含一個版面配置,顯示擷取期間執行之所有函式的呼叫圖。每個執行過程式碼的執行緒都是樹狀結構中的最上層節點。檢視中的欄集合可用來檢查每次呼叫的各種統計資料,包括快取遺漏次數、依指令類型的細分等。可以使用 *Event List Counters* 面板自訂要顯示的欄集合。
可以從 **Source** 檢視複製文字並貼到其他工具中,以支援其他分析情境。選取要複製的文字後,使用 Ctrl+C 將文字複製到剪貼簿。可以使用 Ctrl+A 選取 **Source** 檢視中的所有文字。
### Callgraph
指令追蹤包含一個版面配置,顯示擷取期間執行之所有函式的呼叫圖。每個執行過程式碼的執行緒都是樹狀結構中的最上層節點。檢視中的欄集合可用來檢查每次呼叫的各種統計資料,包括快取遺漏次數、依指令類型的細分等。可以使用 *Event List Counters* 面板自訂要顯示的欄集合。
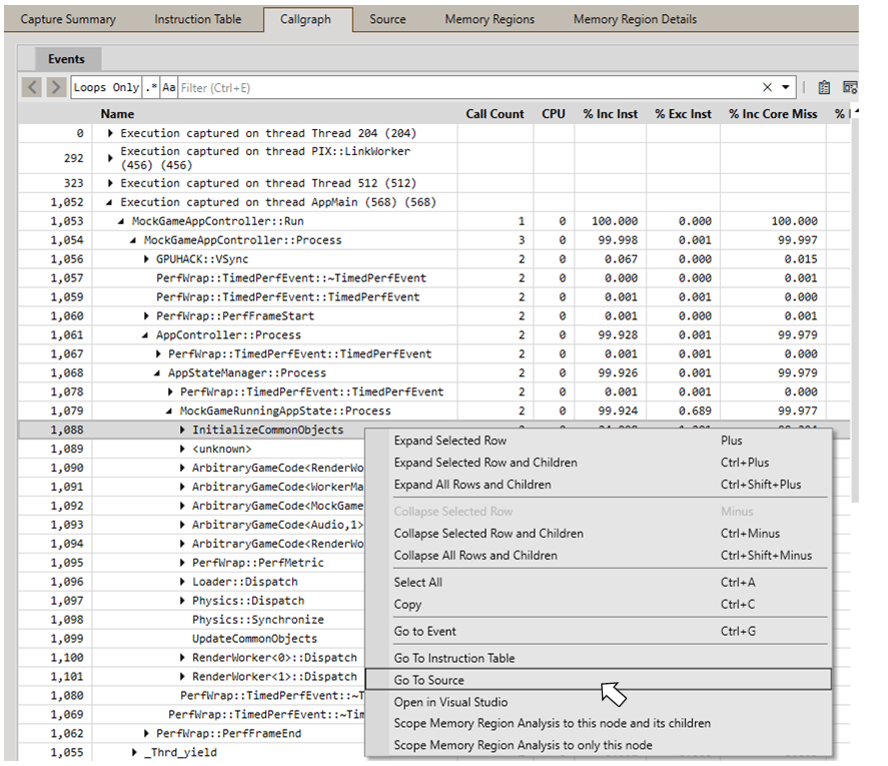
 以滑鼠右鍵按一下呼叫圖中的函式,會開啟包含數個選項的操作功能表,讓您進一步探索該函式,如下圖所示。選項包括檢視函式的原始程式碼與組譯程式碼混合,以及開啟範圍限定為該函式所存取記憶體的 [**Memory Regions**](#itrace_memory_regions_view) 版面配置。
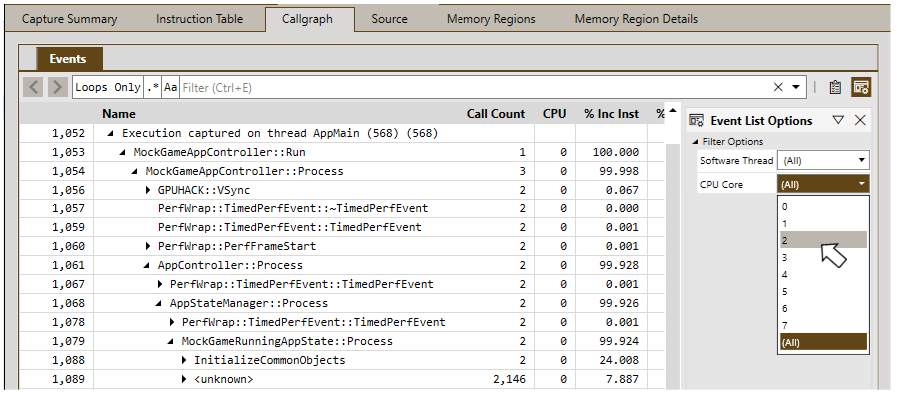
 可以使用 *Event List Options* 面板將呼叫圖篩選為特定執行緒或核心。
 呼叫圖頂端的篩選列有一個 **Loops Only** 按鈕,可將資料篩選為包含迴圈的函式。迴圈通常是值得調查效能問題的程式碼區段。常見問題包括不必要的巢狀結構與低效率的資料結構周遊。
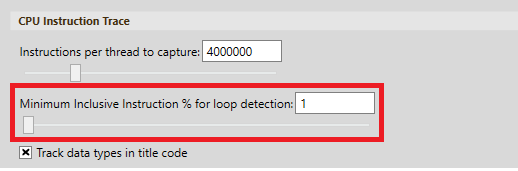
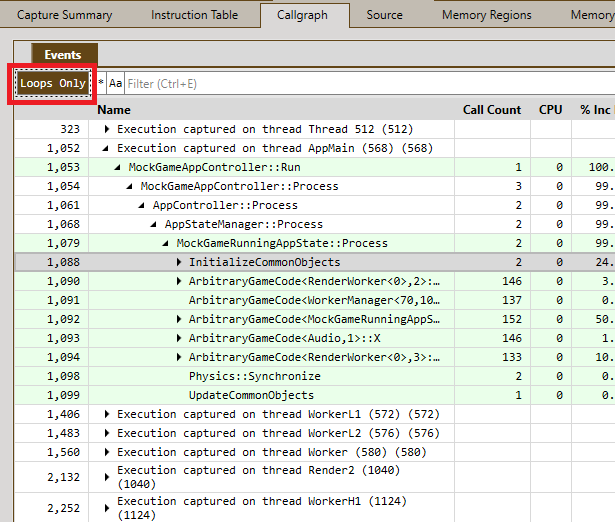 根據預設,只會顯示包含在其包含指令數佔擷取中所有已執行指令 1% 以上之函式中的迴圈。可以使用 *Minimum Inclusive Instruction % for loop detection* 設定調整此容許值,此設定位於 **Settings** 檢視的 *CPU Instruction Trace* 區段下。
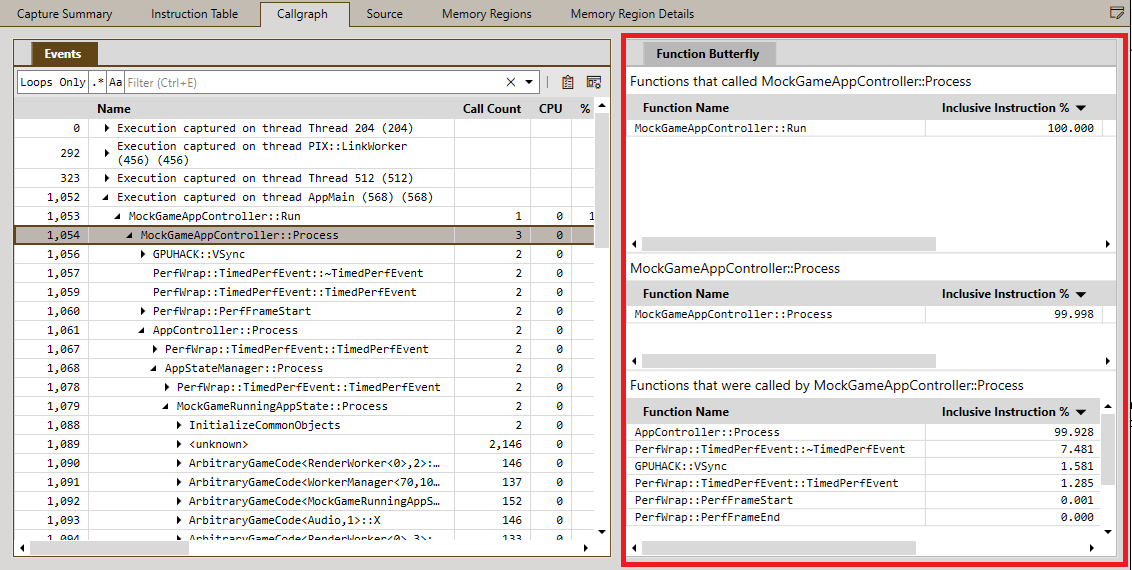
 版面配置右側的 *Butterfly* 檢視會顯示所選函式的呼叫端與被呼叫端。按一下呼叫圖中的一列,會將該函式設為蝴蝶檢視中的焦點函式。焦點函式會顯示在檢視的中間表格中。檢視中的上方表格列出焦點函式的所有呼叫端。下方表格列出焦點函式所呼叫的所有函式。在呼叫端或被呼叫端表格中按兩下函式,會將該函式設為新的焦點函式,讓您輕鬆瀏覽一系列函式的呼叫端與被呼叫端。
 ### Memory Regions
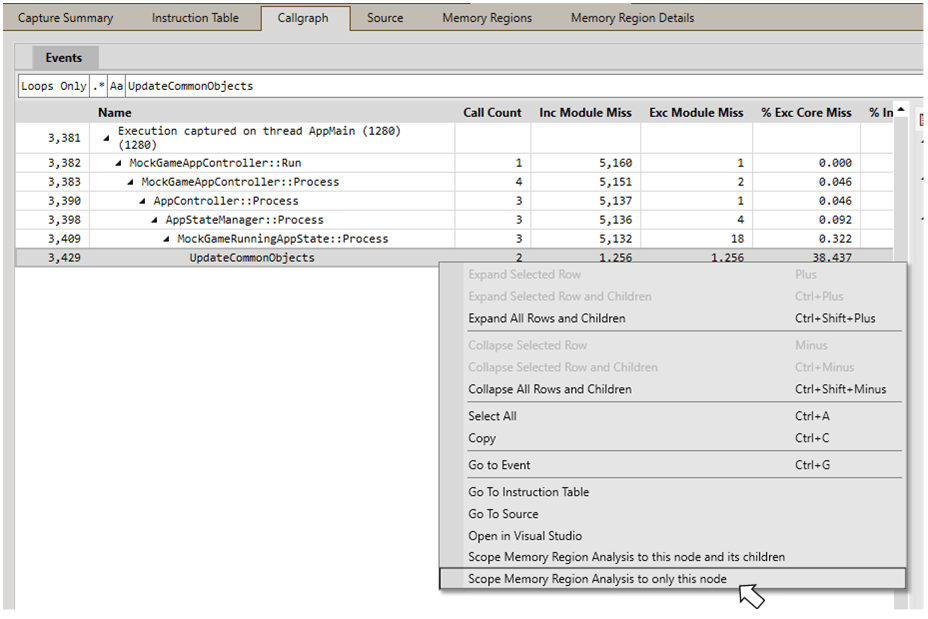
**Memory Regions** 版面配置提供一組位址範圍之記憶體存取模式的詳細資料。這些詳細資料包括每個快取行中被存取的個別位元組集合,以及與每次記憶體存取相關聯的函式與資料類型集合。當 **Memory Regions** 版面配置顯示的資料範圍限定於特定函式時最為實用。常見的工作流程是使用 [Summary](#itrace_summary_view) 版面配置或 [Callgraph](#itrace_callgraph_view) 版面配置識別造成資料快取遺漏的函式,然後使用 [Callgraph](#itrace_callgraph_view) 版面配置中的操作功能表瀏覽至 **Memory Regions** 版面配置。在下圖中,根據 [Callgraph](#itrace_callgraph_view) 版面配置中顯示的高快取遺漏次數,名為 *UpdateCommonObjects* 的函式已被識別為值得關注的函式。使用 *Scope Memory Analysis to only this node* 操作功能表項目瀏覽至 **Memory Regions** 版面配置。
### Memory Regions
**Memory Regions** 版面配置提供一組位址範圍之記憶體存取模式的詳細資料。這些詳細資料包括每個快取行中被存取的個別位元組集合,以及與每次記憶體存取相關聯的函式與資料類型集合。當 **Memory Regions** 版面配置顯示的資料範圍限定於特定函式時最為實用。常見的工作流程是使用 [Summary](#itrace_summary_view) 版面配置或 [Callgraph](#itrace_callgraph_view) 版面配置識別造成資料快取遺漏的函式,然後使用 [Callgraph](#itrace_callgraph_view) 版面配置中的操作功能表瀏覽至 **Memory Regions** 版面配置。在下圖中,根據 [Callgraph](#itrace_callgraph_view) 版面配置中顯示的高快取遺漏次數,名為 *UpdateCommonObjects* 的函式已被識別為值得關注的函式。使用 *Scope Memory Analysis to only this node* 操作功能表項目瀏覽至 **Memory Regions** 版面配置。
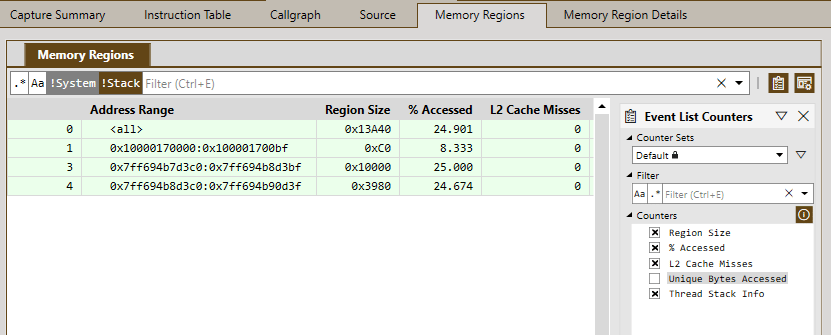
 *Memory Regions* 表格會顯示目前分析的位址範圍集合。可用的欄包括區域大小、L2 資料快取遺漏次數,以及記憶體區域被存取的百分比。記憶體區域的大小通常為 64K。大小小於 64k 的範圍,表示記憶體存取之間的位址有明顯的間隙。篩選列中的 *!System* 與 *!Stack* 按鈕可用來排除只由系統程式碼存取的記憶體區域,或對應於堆疊存取的記憶體區域。可以使用 *Event List Counters* 面板自訂要顯示的欄集合。
 在 *Memory Regions* 表格中選取一列,會填入 *Byte Access Map*、*Accessing functions* 與 *Accessed Types* 檢視。*Byte Access Map* 提供快取行中個別位元組的記憶體存取詳細資料。檢視中的每一列代表一個快取行。列中的 64 個方塊代表該行中的個別位元組。綠色方塊代表被存取的位元組,白色方塊代表未被存取的位元組。將滑鼠指標停留在一組方塊上,會顯示包含資料類型資訊 (若有) 的工具提示。如果開始擷取之前選取了 *Track Data Types* 選項,就會提供資料類型資訊。
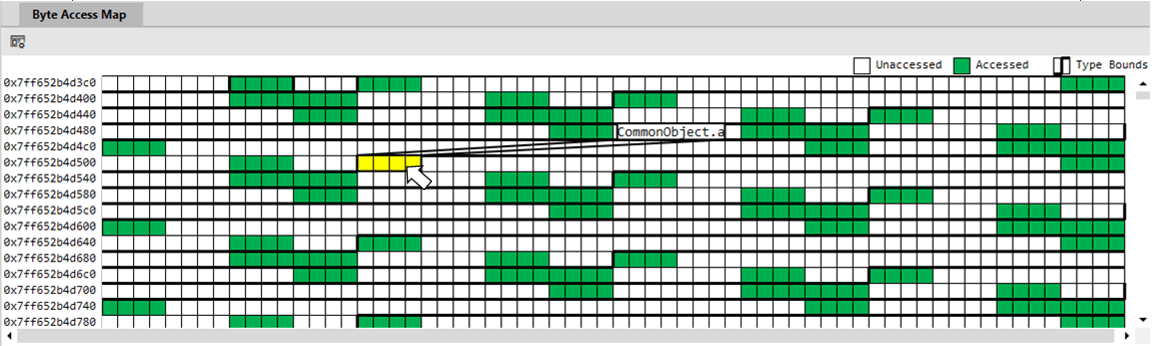
下列 *Byte Access Map* 顯示相對低效率 (稀疏) 的資料存取模式,從相對較少的綠色方塊以及被存取位元組之間的明顯間隙即可看出。工具提示顯示,反白顯示的綠色方塊集合代表對名為 *CommonObject* 之資料結構的欄位 *a* 的存取。
在 *Memory Regions* 表格中選取一列,會填入 *Byte Access Map*、*Accessing functions* 與 *Accessed Types* 檢視。*Byte Access Map* 提供快取行中個別位元組的記憶體存取詳細資料。檢視中的每一列代表一個快取行。列中的 64 個方塊代表該行中的個別位元組。綠色方塊代表被存取的位元組,白色方塊代表未被存取的位元組。將滑鼠指標停留在一組方塊上,會顯示包含資料類型資訊 (若有) 的工具提示。如果開始擷取之前選取了 *Track Data Types* 選項,就會提供資料類型資訊。
下列 *Byte Access Map* 顯示相對低效率 (稀疏) 的資料存取模式,從相對較少的綠色方塊以及被存取位元組之間的明顯間隙即可看出。工具提示顯示,反白顯示的綠色方塊集合代表對名為 *CommonObject* 之資料結構的欄位 *a* 的存取。
 *Accessing Functions* 表格列出存取目前所選範圍中記憶體的函式集合。如果列出多個函式,選取某個函式會更新 *Byte Access Map*,以反白顯示該函式所進行的存取。
*Accessed Types* 檢視列出在目前所選範圍中被存取的資料類型集合。如果資料類型是結構,檢視會附註結構中每個欄位被存取的時間百分比。下圖顯示一個類型,其中欄位 *a*、*g*、*i* 與 *k* 在 100% 的時間被存取,而其他欄位則從未被存取。
*Accessing Functions* 表格列出存取目前所選範圍中記憶體的函式集合。如果列出多個函式,選取某個函式會更新 *Byte Access Map*,以反白顯示該函式所進行的存取。
*Accessed Types* 檢視列出在目前所選範圍中被存取的資料類型集合。如果資料類型是結構,檢視會附註結構中每個欄位被存取的時間百分比。下圖顯示一個類型,其中欄位 *a*、*g*、*i* 與 *k* 在 100% 的時間被存取,而其他欄位則從未被存取。
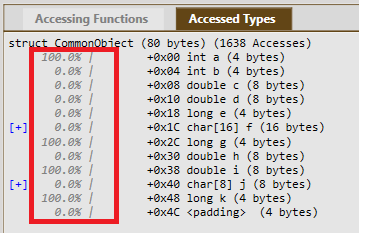 也會提供每個欄位的大小資訊,以及類型本身的大小。
如 *Byte Access Map* 與 *Accessed Functions* 清單所示,*CommonObject* 結構的稀疏存取模式,代表有機會重構該資料類型以及存取它的程式碼,以更有效率地使用主機的資料快取。
### Memory Region Details
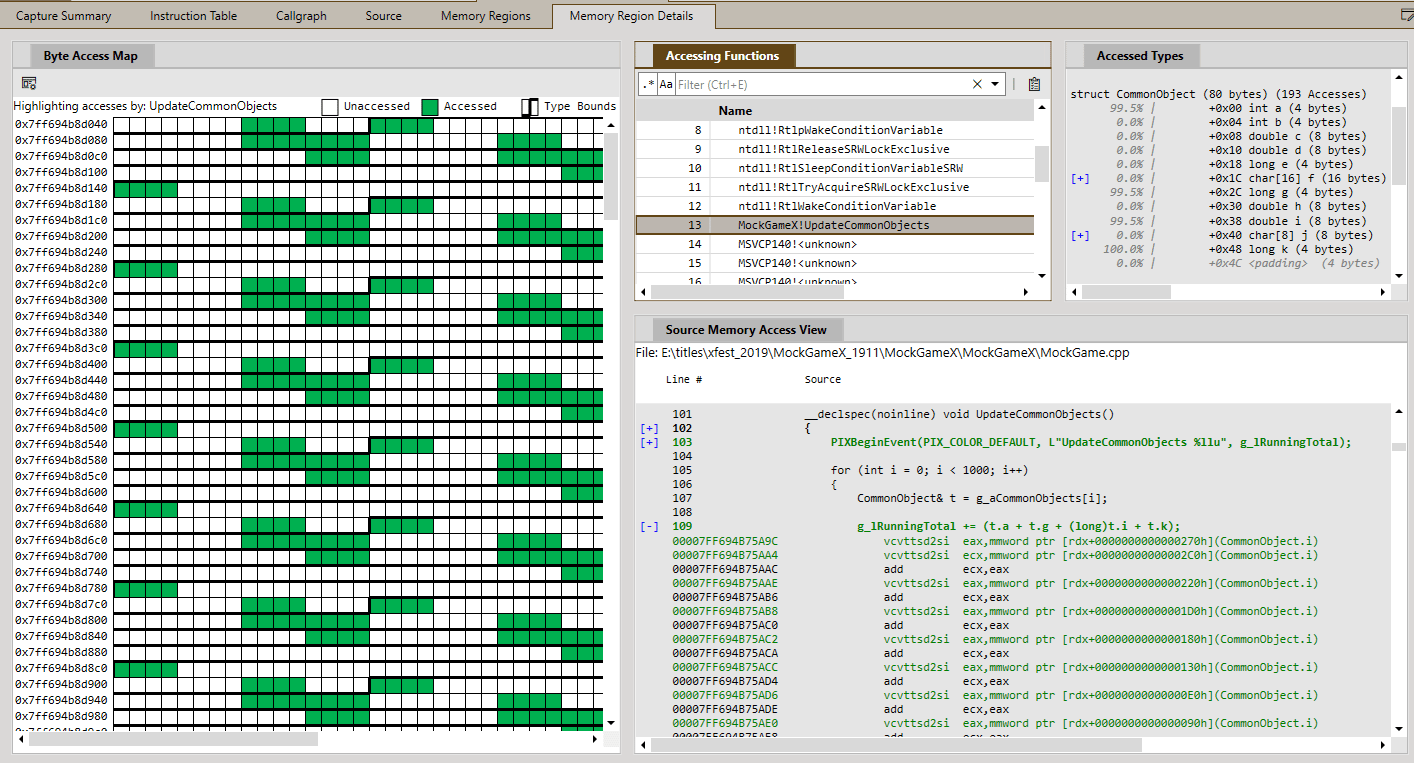
**Memory Region Details** 版面配置透過提供 *Source Memory Access* 檢視,提供更進一步的快取行分析。此檢視提供與組譯指令及資料類型資訊交錯顯示的 C++ 原始程式碼,確切顯示函式中有哪些行影響該記憶體區域。以綠色反白顯示的原始程式碼行與組譯行正在存取記憶體區域中的資料。在 *Accessing Functions* 檢視中選取不同的函式,會以所選函式的特定資訊更新 *Byte Access Map* 與 *Source Memory Access* 檢視。
也會提供每個欄位的大小資訊,以及類型本身的大小。
如 *Byte Access Map* 與 *Accessed Functions* 清單所示,*CommonObject* 結構的稀疏存取模式,代表有機會重構該資料類型以及存取它的程式碼,以更有效率地使用主機的資料快取。
### Memory Region Details
**Memory Region Details** 版面配置透過提供 *Source Memory Access* 檢視,提供更進一步的快取行分析。此檢視提供與組譯指令及資料類型資訊交錯顯示的 C++ 原始程式碼,確切顯示函式中有哪些行影響該記憶體區域。以綠色反白顯示的原始程式碼行與組譯行正在存取記憶體區域中的資料。在 *Accessing Functions* 檢視中選取不同的函式,會以所選函式的特定資訊更新 *Byte Access Map* 與 *Source Memory Access* 檢視。
 ## 最佳做法與限制
指令追蹤會顯示 L1 與 L2 資料快取遺漏。當擷取是針對 XBOX Series X 開發套件或 XBOX Series S 測試套件進行時,也會提供 L3 遺漏。這些計數會出現在整個擷取的各種版面配置中。快取遺漏次數是根據快取模擬,而不是根據實際的硬體計數器或事件。之所以使用模擬,是因為指令追蹤會對每個執行的指令產生額外處理,這會扭曲任何實際的硬體計數器。不過,在分析快取模擬所產生的資料時,有一些因素需要考量。
* 快取被假設為冷快取,因此初始遺漏可能不準確。
* 未模擬載入快取行的延遲。
* 未模擬回寫 (預設的快取記憶體) 以外的記憶體類型。
* 未模擬硬體預先擷取器。
* 由於未完整模擬非循序執行,因此未模擬任何推測性記憶體存取。
另請注意,如果遊戲目前停在偵錯工具中的中斷點,就無法使用指令追蹤。
## 另請參閱
[PIX](/zh-TW/tools/tools-console/pix/pix)
## Related topics
- [PIXBeginCapture](/zh-TW/reference/tools/pix3/functions/pixbegincapture.md)
- [PIXGetCaptureState](/zh-TW/reference/tools/pix3/functions/pixgetcapturestate.md)
- [NDA 主題目錄 - Microsoft Learn 線上連結](/zh-TW/nda/nda-topic-directory.md)
- [適用於 GDK 遊戲的 XBOX 與 Windows 版 PIX](/zh-TW/tools/tools-console/pix/index.md)
- [XBOX Series 主機上的 PIX GPU 追蹤擷取](/zh-TW/tools/tools-console/pix/gpu-trace/index.md)
## 最佳做法與限制
指令追蹤會顯示 L1 與 L2 資料快取遺漏。當擷取是針對 XBOX Series X 開發套件或 XBOX Series S 測試套件進行時,也會提供 L3 遺漏。這些計數會出現在整個擷取的各種版面配置中。快取遺漏次數是根據快取模擬,而不是根據實際的硬體計數器或事件。之所以使用模擬,是因為指令追蹤會對每個執行的指令產生額外處理,這會扭曲任何實際的硬體計數器。不過,在分析快取模擬所產生的資料時,有一些因素需要考量。
* 快取被假設為冷快取,因此初始遺漏可能不準確。
* 未模擬載入快取行的延遲。
* 未模擬回寫 (預設的快取記憶體) 以外的記憶體類型。
* 未模擬硬體預先擷取器。
* 由於未完整模擬非循序執行,因此未模擬任何推測性記憶體存取。
另請注意,如果遊戲目前停在偵錯工具中的中斷點,就無法使用指令追蹤。
## 另請參閱
[PIX](/zh-TW/tools/tools-console/pix/pix)
## Related topics
- [PIXBeginCapture](/zh-TW/reference/tools/pix3/functions/pixbegincapture.md)
- [PIXGetCaptureState](/zh-TW/reference/tools/pix3/functions/pixgetcapturestate.md)
- [NDA 主題目錄 - Microsoft Learn 線上連結](/zh-TW/nda/nda-topic-directory.md)
- [適用於 GDK 遊戲的 XBOX 與 Windows 版 PIX](/zh-TW/tools/tools-console/pix/index.md)
- [XBOX Series 主機上的 PIX GPU 追蹤擷取](/zh-TW/tools/tools-console/pix/gpu-trace/index.md)