> ## Documentation Index
> Fetch the complete documentation index at: https://devdocs.xbox.com/llms.txt
> Use this file to discover all available pages before exploring further.
# 使用 Visual Studio 调试 XBOX 项目
> 使用 Visual Studio 调试 XBOX 项目
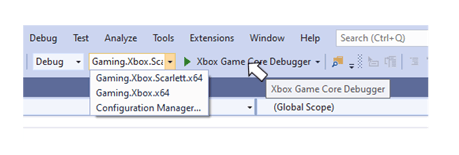
在 Visual Studio 中调试 XBOX Microsoft Game Development Kit (GDK) 项目由 XBOX Debugger 组件启用,该组件作为 Microsoft Game Development Kit (GDK) 的一部分安装。支持 Visual Studio 2019 和 2022。如以下截图所示,XBOX Debugger 是所有平台为 Gaming.Xbox.One.x64 或 Gaming.Xbox.Scarlett.x64 项目的默认调试器。
 ## 配置 Visual Studio 调试器
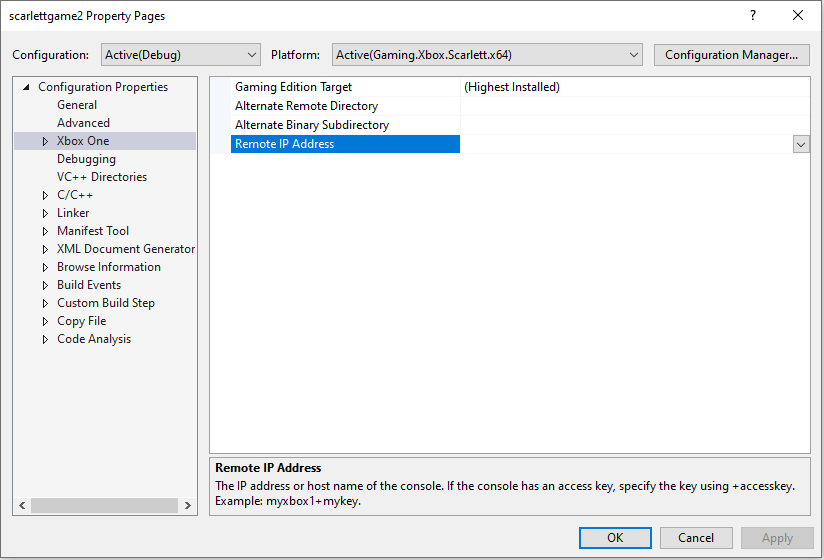
在 Visual Studio 中通过 F5 启动调试器时,默认使用通过其他 Microsoft Game Development Kit (GDK) 工具(例如 [XBOX Manager](/tools/tools-console/xbom/xbom) 或 [xbConnect](/tools/tools-console/commandlinetools/xbconnect))设置的默认主机。要覆盖此行为,可通过项目属性页面的 **XBOX One** 部分下的 **Remote IP Address** 属性指定一个主机,如下截图所示。
## 配置 Visual Studio 调试器
在 Visual Studio 中通过 F5 启动调试器时,默认使用通过其他 Microsoft Game Development Kit (GDK) 工具(例如 [XBOX Manager](/tools/tools-console/xbom/xbom) 或 [xbConnect](/tools/tools-console/commandlinetools/xbconnect))设置的默认主机。要覆盖此行为,可通过项目属性页面的 **XBOX One** 部分下的 **Remote IP Address** 属性指定一个主机,如下截图所示。
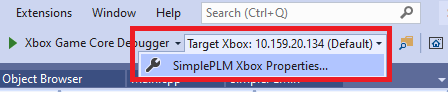
 Visual Studio 中的调试工具栏包含一个下拉列表,用于指示通过 F5 或 Ctrl-F5 启动时 title 将部署到哪个主机。该下拉列表带有一个按钮,可在需要更改目标主机时快速访问项目属性页。
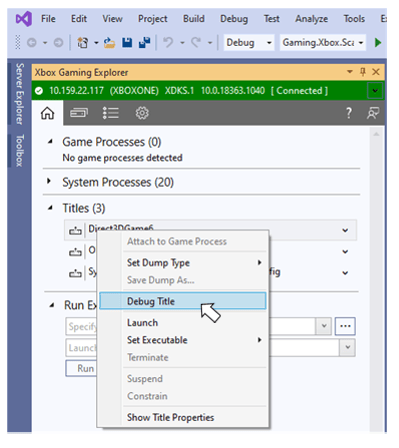
 也可以从 [XBOX Gaming Explorer](/tools/tools-console/visualstudio/xbox-gaming-explorer) 启动调试器。在此情况下,使用的主机为 XBOX Gaming Explorer 顶部连接功能区中标识的主机,如下截图所示。
 ### 符号路径
Game OS 若干组件的程序数据库 (.pdb) 文件在使用 Visual Studio 进行调试时可用。配置 Visual Studio 使用这些符号可在中断进入调试器时获得例如更完整的调用堆栈。
部分 Game OS 符号由 Microsoft Game Development Kit (GDK) 安装程序安装到你的开发 PC 上,另一部分可从 Microsoft 公共符号服务器获取。
由安装程序安装的 Game OS 符号位于开发 PC 上的 *C:\Program Files (x86)\Microsoft GDK\\GXDK\gameKit\symbols*。平台无关的 .pdb 位于符号文件夹的根目录,平台特定的 .pdb 位于 *Xbox Series X|S* 与 *XboxOne* 子目录中。
要将本地 PC 上 Game OS 符号目录的路径添加进去,可使用 Visual Studio **Options** 对话框 **Debugging** 部分下的 **Symbols** 设置,如下截图所示。
### 符号路径
Game OS 若干组件的程序数据库 (.pdb) 文件在使用 Visual Studio 进行调试时可用。配置 Visual Studio 使用这些符号可在中断进入调试器时获得例如更完整的调用堆栈。
部分 Game OS 符号由 Microsoft Game Development Kit (GDK) 安装程序安装到你的开发 PC 上,另一部分可从 Microsoft 公共符号服务器获取。
由安装程序安装的 Game OS 符号位于开发 PC 上的 *C:\Program Files (x86)\Microsoft GDK\\GXDK\gameKit\symbols*。平台无关的 .pdb 位于符号文件夹的根目录,平台特定的 .pdb 位于 *Xbox Series X|S* 与 *XboxOne* 子目录中。
要将本地 PC 上 Game OS 符号目录的路径添加进去,可使用 Visual Studio **Options** 对话框 **Debugging** 部分下的 **Symbols** 设置,如下截图所示。
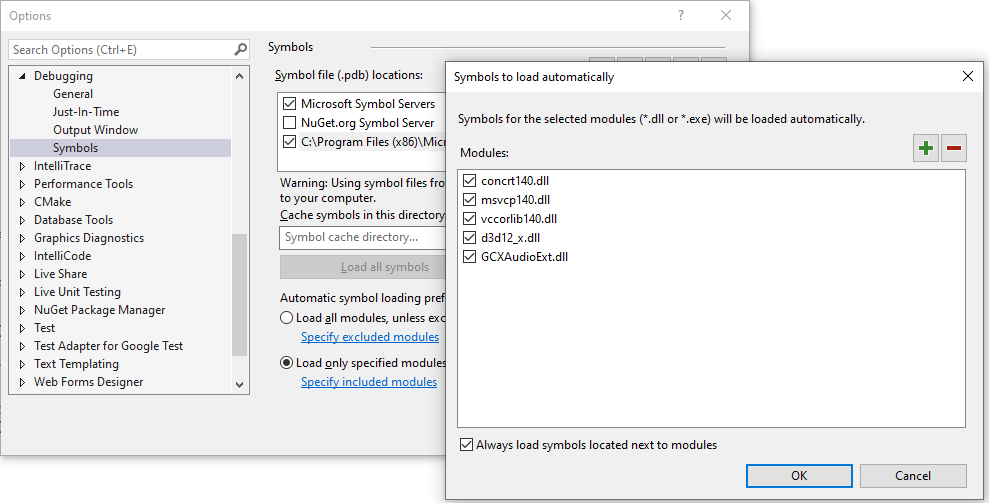
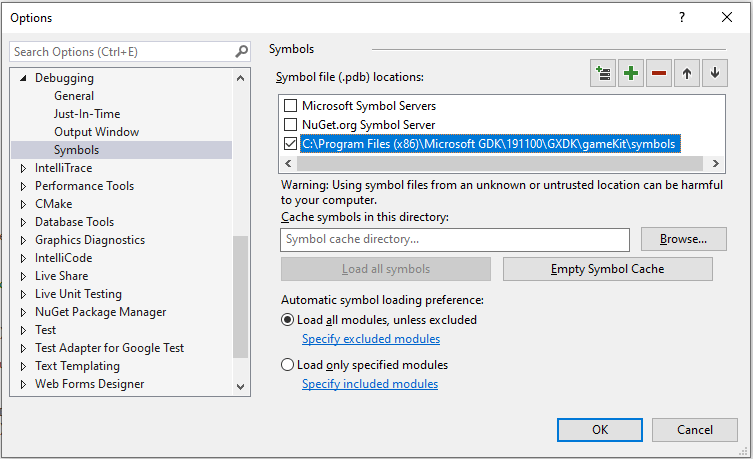 要访问 Microsoft 公共符号服务器上可用的 Game OS 符号,请在 **Symbols** 对话框中勾选 **Microsoft Symbol Servers** 复选框。将 Microsoft 符号服务器添加为符号文件位置会让 Visual Studio 在符号服务器上搜索你的 title 所加载的所有二进制文件。全面的符号搜索可能耗时较长。你可以配置 Visual Studio 只查找 title 所使用的特定二进制文件集合的 .pdb,从而缩短此搜索时间。要指定 Visual Studio 应在其中查找 .pdb 的二进制集合,可在 **Options** 对话框中使用 **Load only specified modules** 选项。以下截图显示了 Visual Studio 配置为仅为少数选定二进制文件从公共符号服务器加载符号。
 ### 与调试相关的属性
可以通过项目属性对话框以及 [XBOX Gaming Explorer](/tools/tools-console/visualstudio/xbox-gaming-explorer) 的 **Settings** 选项卡中公开的一组属性进一步配置调试器。这些属性包括例如向你的 title 传递命令行参数以及开启日志模块加载等能力。有关可用属性的详情,请参见 [Visual Studio Properties for XBOX Development](/tools/tools-console/visualstudio/durango-property-pages) 和 [XBOX Gaming Explorer](/tools/tools-console/visualstudio/xbox-gaming-explorer)。
## 附加到正在运行的 title
XBOX 菜单以及 [XBOX Gaming Explorer](/tools/tools-console/visualstudio/xbox-gaming-explorer) 都包含用于将调试器附加到主机上正在运行游戏的菜单选项。
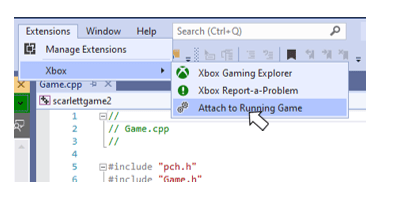
要附加到当前正在你默认主机上运行的游戏,请使用 **XBOX** 菜单上的 **Attach to Running Game**。**XBOX** 菜单可从 Visual Studio 菜单栏访问,如下截图所示。
### 与调试相关的属性
可以通过项目属性对话框以及 [XBOX Gaming Explorer](/tools/tools-console/visualstudio/xbox-gaming-explorer) 的 **Settings** 选项卡中公开的一组属性进一步配置调试器。这些属性包括例如向你的 title 传递命令行参数以及开启日志模块加载等能力。有关可用属性的详情,请参见 [Visual Studio Properties for XBOX Development](/tools/tools-console/visualstudio/durango-property-pages) 和 [XBOX Gaming Explorer](/tools/tools-console/visualstudio/xbox-gaming-explorer)。
## 附加到正在运行的 title
XBOX 菜单以及 [XBOX Gaming Explorer](/tools/tools-console/visualstudio/xbox-gaming-explorer) 都包含用于将调试器附加到主机上正在运行游戏的菜单选项。
要附加到当前正在你默认主机上运行的游戏,请使用 **XBOX** 菜单上的 **Attach to Running Game**。**XBOX** 菜单可从 Visual Studio 菜单栏访问,如下截图所示。
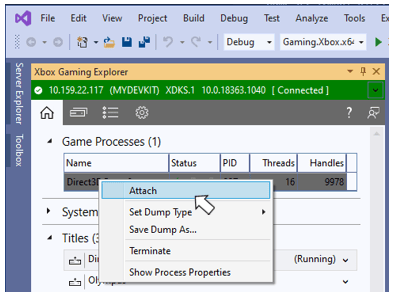
 你也可以附加到已通过 [XBOX Gaming Explorer](/tools/tools-console/visualstudio/xbox-gaming-explorer) 添加的任何主机上正在运行的游戏。**Home** 选项卡中 **Game Processes** 和 **Titles** 部分的上下文菜单都包含用于附加到运行中游戏的菜单项,如下截图所示。
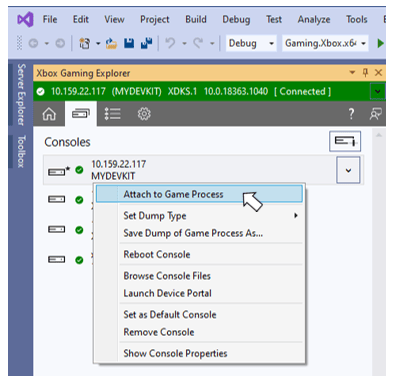
 **Consoles** 选项卡中特定主机的上下文菜单可用于附加到该主机上正在运行的游戏,如下截图所示。
 Visual Studio **Debug** 菜单下的 **Attach** 对话框也可用于附加到正在运行的 title。使用 Visual Studio 2022 时,在 **Connection Type** 下拉列表中选择 **XBOX Direct Connection**,并在 **Connection Target** 文本框中输入主机的 Host IP 或 System IP 地址。Host 与 System IP 地址可以使用 [xbconnect](/tools/tools-console/commandlinetools/xbconnect) 命令行工具确定。
虽然可以使用 Host IP 或 System IP 附加到 title,但在同一会话中多次附加时应避免混用两者。例如,如果最初使用 Host IP 附加,后续附加时应继续使用 Host IP。
Visual Studio **Debug** 菜单下的 **Attach** 对话框也可用于附加到正在运行的 title。使用 Visual Studio 2022 时,在 **Connection Type** 下拉列表中选择 **XBOX Direct Connection**,并在 **Connection Target** 文本框中输入主机的 Host IP 或 System IP 地址。Host 与 System IP 地址可以使用 [xbconnect](/tools/tools-console/commandlinetools/xbconnect) 命令行工具确定。
虽然可以使用 Host IP 或 System IP 附加到 title,但在同一会话中多次附加时应避免混用两者。例如,如果最初使用 Host IP 附加,后续附加时应继续使用 Host IP。
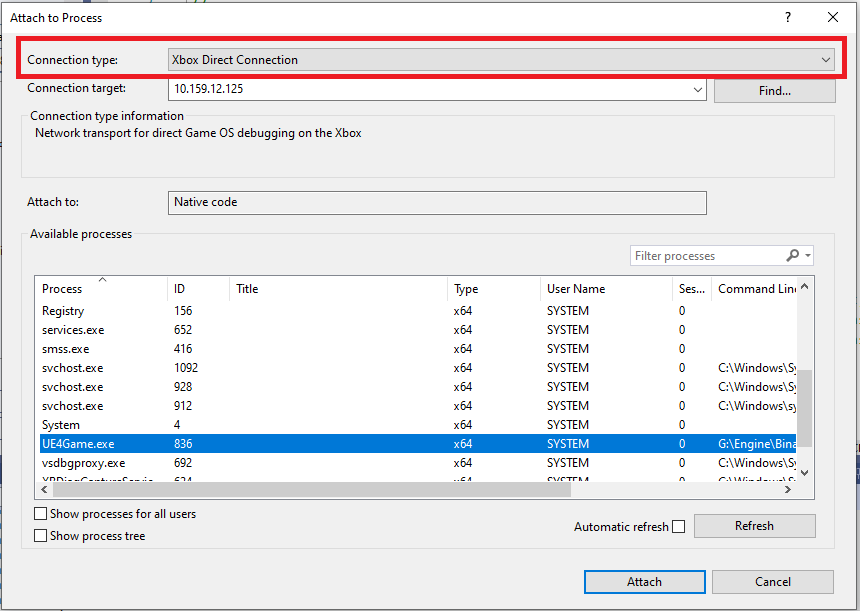 使用 Visual Studio 2019 时,在 **Connection Type** 下拉列表中选择 **Remote No Authentication**,并在 **Connection Target** 文本框中输入主机的 Host IP 地址。
## 使用 Visual Studio 2022 调试 XBOX 项目
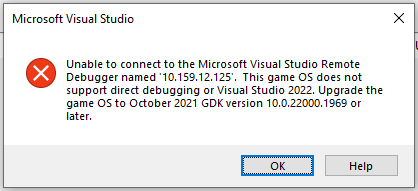
使用 Visual Studio 2022 进行调试要求所调试的 title 是使用 2021 年 10 月(或更新版本)Microsoft Game Development Kit (GDK) 构建的。存在对 2021 年 10 月(或更新版本)Microsoft Game Development Kit (GDK) 的依赖,是因为这些 Microsoft Game Development Kit (GDK) 版本中附带的 Game OS 包含使用 Visual Studio 2022 调试所需的二进制文件。若在较旧的 Game OS 上尝试使用 Visual Studio 2022 调试,将会显示以下错误。
使用 Visual Studio 2019 时,在 **Connection Type** 下拉列表中选择 **Remote No Authentication**,并在 **Connection Target** 文本框中输入主机的 Host IP 地址。
## 使用 Visual Studio 2022 调试 XBOX 项目
使用 Visual Studio 2022 进行调试要求所调试的 title 是使用 2021 年 10 月(或更新版本)Microsoft Game Development Kit (GDK) 构建的。存在对 2021 年 10 月(或更新版本)Microsoft Game Development Kit (GDK) 的依赖,是因为这些 Microsoft Game Development Kit (GDK) 版本中附带的 Game OS 包含使用 Visual Studio 2022 调试所需的二进制文件。若在较旧的 Game OS 上尝试使用 Visual Studio 2022 调试,将会显示以下错误。
 ## 调试打包构建
在 XBOX One Software Development Kit 的发布版本中,调试打包构建的工作流涉及使用 Visual Studio 中的 **Debug Installed App Packages** 菜单项。此工作流在 Microsoft Game Development Kit (GDK) 2019 年 9 月版中得到了极大简化,如本节所述。
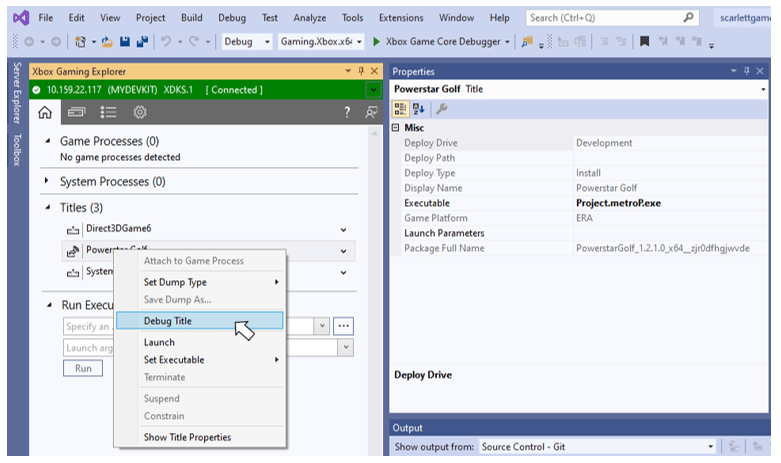
[XBOX Gaming Explorer](/tools/tools-console/visualstudio/xbox-gaming-explorer) 中用于在调试器下启动 title 或附加到运行中 title 的上下文菜单选项,对打包构建和松散文件部署同样有效。
流式安装包通过 [XBOX Gaming Explorer](/tools/tools-console/visualstudio/xbox-gaming-explorer) 中的 **Install** 部署类型和图标进行识别,如下截图所示。
## 调试打包构建
在 XBOX One Software Development Kit 的发布版本中,调试打包构建的工作流涉及使用 Visual Studio 中的 **Debug Installed App Packages** 菜单项。此工作流在 Microsoft Game Development Kit (GDK) 2019 年 9 月版中得到了极大简化,如本节所述。
[XBOX Gaming Explorer](/tools/tools-console/visualstudio/xbox-gaming-explorer) 中用于在调试器下启动 title 或附加到运行中 title 的上下文菜单选项,对打包构建和松散文件部署同样有效。
流式安装包通过 [XBOX Gaming Explorer](/tools/tools-console/visualstudio/xbox-gaming-explorer) 中的 **Install** 部署类型和图标进行识别,如下截图所示。
 ## 调试 Game Lifecycle 状态之间的转换
要正确支持 [Game Lifecycle](/build/console-features/console-workflows/xbox-game-life-cycle),需要为 full、suspended 和 constrained 生命周期状态之间的转换编写事件处理程序。Visual Studio 提供了多项功能,可帮助你编写让你的 title 成功通过 Game Lifecycle 状态转换所需的健壮事件处理程序。
[XBOX Gaming Explorer](/tools/tools-console/visualstudio/xbox-gaming-explorer) 中的上下文菜单包含 **Suspend**、**Resume** 和 **Constrain** 你的 title 的选项,可让你在开发套件上调试自己的处理程序。
## 调试 Game Lifecycle 状态之间的转换
要正确支持 [Game Lifecycle](/build/console-features/console-workflows/xbox-game-life-cycle),需要为 full、suspended 和 constrained 生命周期状态之间的转换编写事件处理程序。Visual Studio 提供了多项功能,可帮助你编写让你的 title 成功通过 Game Lifecycle 状态转换所需的健壮事件处理程序。
[XBOX Gaming Explorer](/tools/tools-console/visualstudio/xbox-gaming-explorer) 中的上下文菜单包含 **Suspend**、**Resume** 和 **Constrain** 你的 title 的选项,可让你在开发套件上调试自己的处理程序。
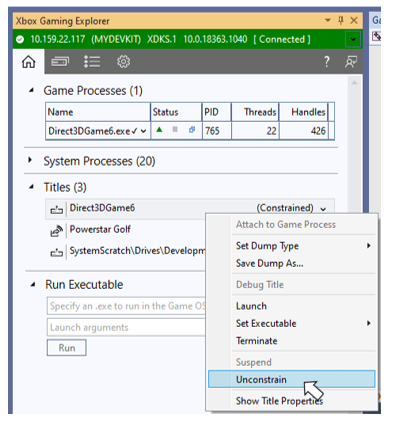 请注意,你也可以从 [XBOX Manager](/tools/tools-console/xbom/xbom) 和 [xbApp](/tools/tools-console/commandlinetools/xbapp) 命令行工具手动触发这些状态转换。
无论状态转换是如何触发的,描述该转换以及任何失败情况的诊断消息都可以在 [xbWatson](/tools/tools-console/xbWatson/xbwatson) 以及 Visual Studio 内的 [XBOX System Monitor](/tools/tools-console/visualstudio/xbox-system-monitor) 窗口中查看。
在正式环境中,**Suspend** 事件的处理程序必须在 1 秒内完成,否则系统会终止你的 title。此 suspend 时间限制显然不应始终在开发套件上强制执行,否则调试 **Suspend** 处理程序将几乎不可能完成。
默认情况下,当 Visual Studio 调试器(或其他用户模式调试器)已附加时,1 秒的 suspend 超时会被禁用,让你有时间完成调试任务。
Visual Studio 调试器也可以配置为在附加时重新启用 suspend 超时。在此模式下,如果你的 **Suspend** 处理程序未在 1 秒内完成,调试器会强制中断,让你可以看到 suspend 时间限制到期时 **Suspend** 处理程序执行到了哪一步。以此模式运行调试器有助于了解你的 **Suspend** 处理程序超时的频率及原因。设置 Visual Studio 中的 **Break On Suspend Timeout** 属性可将调试器置于启用 suspend 超时的模式。此模式下发生的调试中断是在调试器注入到进程中的一个新线程上完成的。切换到包含 **Suspend** 处理程序的线程即可开始调试。
请注意,你也可以从 [XBOX Manager](/tools/tools-console/xbom/xbom) 和 [xbApp](/tools/tools-console/commandlinetools/xbapp) 命令行工具手动触发这些状态转换。
无论状态转换是如何触发的,描述该转换以及任何失败情况的诊断消息都可以在 [xbWatson](/tools/tools-console/xbWatson/xbwatson) 以及 Visual Studio 内的 [XBOX System Monitor](/tools/tools-console/visualstudio/xbox-system-monitor) 窗口中查看。
在正式环境中,**Suspend** 事件的处理程序必须在 1 秒内完成,否则系统会终止你的 title。此 suspend 时间限制显然不应始终在开发套件上强制执行,否则调试 **Suspend** 处理程序将几乎不可能完成。
默认情况下,当 Visual Studio 调试器(或其他用户模式调试器)已附加时,1 秒的 suspend 超时会被禁用,让你有时间完成调试任务。
Visual Studio 调试器也可以配置为在附加时重新启用 suspend 超时。在此模式下,如果你的 **Suspend** 处理程序未在 1 秒内完成,调试器会强制中断,让你可以看到 suspend 时间限制到期时 **Suspend** 处理程序执行到了哪一步。以此模式运行调试器有助于了解你的 **Suspend** 处理程序超时的频率及原因。设置 Visual Studio 中的 **Break On Suspend Timeout** 属性可将调试器置于启用 suspend 超时的模式。此模式下发生的调试中断是在调试器注入到进程中的一个新线程上完成的。切换到包含 **Suspend** 处理程序的线程即可开始调试。
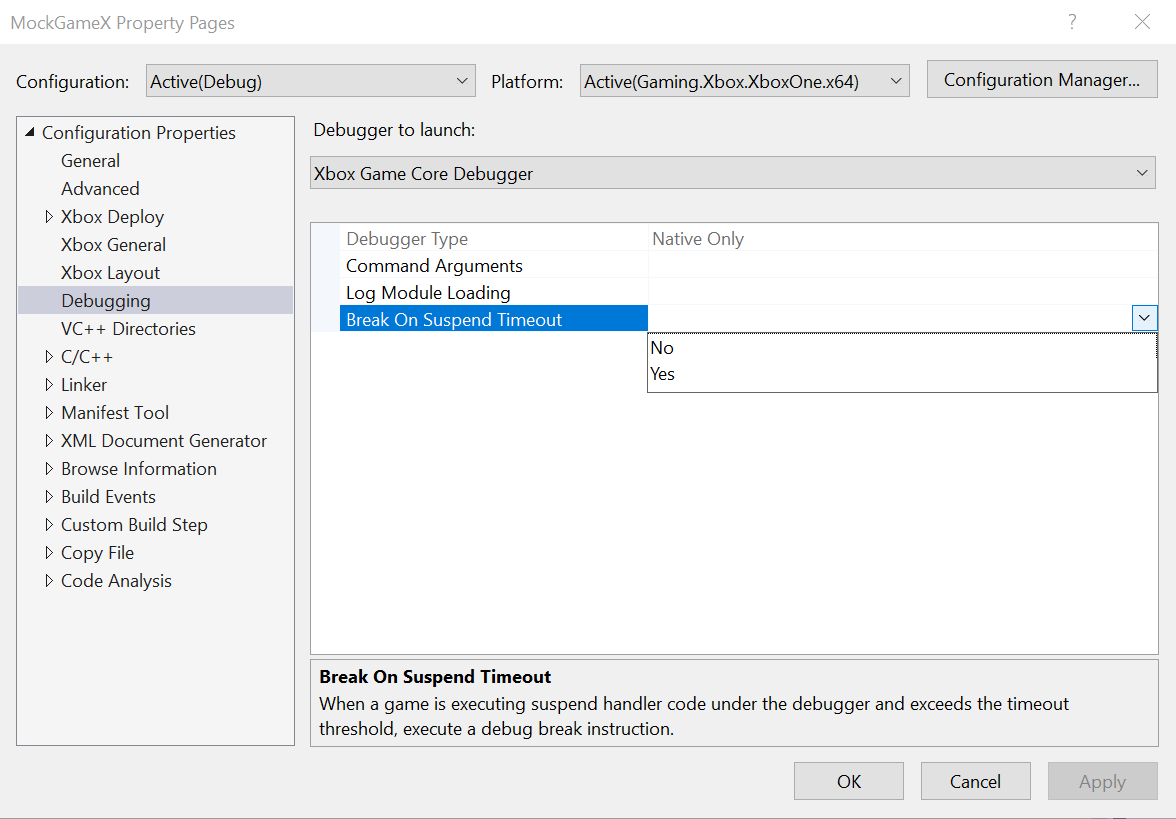 如果 suspend 超时发生时你的 title 没有附加调试器,系统会创建一个 quiesce 崩溃转储。这些转储可以使用 [xbWatson 中的 Memory Dump 面板](/tools/tools-console/xbWatson/xbwatson) 访问。
## Visual Studio 2022 中的 C++ Dynamic Debugging
C++ Dynamic Debugging 是一项新的调试功能,可在不牺牲性能的情况下为优化过的代码提供完整的调试体验。可在任意位置放置去优化断点,并按需对函数进行去优化以单步进入。要启用 C++ Dynamic Debugging:在你的项目上右键,Properties > Configuration Properties > Advanced > Advanced Properties > Use C++ Dynamic Debugging (preview)。使用动态调试功能需要 Visual Studio 2022 的 17.14 Preview 2 或更新版本。有关更多信息请访问 [https://aka.ms/dynamicdebugging](https://aka.ms/dynamicdebugging)。
使用 C++ Dynamic Debugging 所需的 Visual Studio 版本 (17.14) 计划在 2025 年 4 月 GDK 之后发布。在 Visual Studio 17.14 版本发布后,会发布一个 GDK 更新,其中包含 C++ Dynamic Debugging 所需的 C++ debug monitor (msvsmon.exe)。如果你希望在该 GDK 更新发布之前使用 C++ Dynamic Debugging,请联系你的 Microsoft 客户经理,获取有关如何将合适版本的 C++ debug monitor 加载到主机的说明。
## 另请参阅
[XBOX Gaming Explorer](/tools/tools-console/visualstudio/xbox-gaming-explorer)
[Visual Studio](/tools/tools-console/visualstudio/visualstudio)
## Related topics
- [Visual Studio](/zh-CN/tools/tools-console/visualstudio/index.md)
- [Visual Studio 2022 GDK 支持说明](/zh-CN/tools/tools-console/visualstudio/vs-2022-support-notes.md)
- [Visual Studio 2026 GDK 支持说明](/zh-CN/tools/tools-console/visualstudio/vs-2026-support-notes.md)
- [使用 Visual Studio 调试 PC 项目](/zh-CN/tools/tools-pc/visualstudio/gr-vs-debugging-with-visualstudio.md)
- [在 Visual Studio 中远程调试 Windows 设备上的 PC 项目](/zh-CN/tools/tools-pc/visualstudio/gr-vs-debugging-with-visualstudio-remote-windows.md)
如果 suspend 超时发生时你的 title 没有附加调试器,系统会创建一个 quiesce 崩溃转储。这些转储可以使用 [xbWatson 中的 Memory Dump 面板](/tools/tools-console/xbWatson/xbwatson) 访问。
## Visual Studio 2022 中的 C++ Dynamic Debugging
C++ Dynamic Debugging 是一项新的调试功能,可在不牺牲性能的情况下为优化过的代码提供完整的调试体验。可在任意位置放置去优化断点,并按需对函数进行去优化以单步进入。要启用 C++ Dynamic Debugging:在你的项目上右键,Properties > Configuration Properties > Advanced > Advanced Properties > Use C++ Dynamic Debugging (preview)。使用动态调试功能需要 Visual Studio 2022 的 17.14 Preview 2 或更新版本。有关更多信息请访问 [https://aka.ms/dynamicdebugging](https://aka.ms/dynamicdebugging)。
使用 C++ Dynamic Debugging 所需的 Visual Studio 版本 (17.14) 计划在 2025 年 4 月 GDK 之后发布。在 Visual Studio 17.14 版本发布后,会发布一个 GDK 更新,其中包含 C++ Dynamic Debugging 所需的 C++ debug monitor (msvsmon.exe)。如果你希望在该 GDK 更新发布之前使用 C++ Dynamic Debugging,请联系你的 Microsoft 客户经理,获取有关如何将合适版本的 C++ debug monitor 加载到主机的说明。
## 另请参阅
[XBOX Gaming Explorer](/tools/tools-console/visualstudio/xbox-gaming-explorer)
[Visual Studio](/tools/tools-console/visualstudio/visualstudio)
## Related topics
- [Visual Studio](/zh-CN/tools/tools-console/visualstudio/index.md)
- [Visual Studio 2022 GDK 支持说明](/zh-CN/tools/tools-console/visualstudio/vs-2022-support-notes.md)
- [Visual Studio 2026 GDK 支持说明](/zh-CN/tools/tools-console/visualstudio/vs-2026-support-notes.md)
- [使用 Visual Studio 调试 PC 项目](/zh-CN/tools/tools-pc/visualstudio/gr-vs-debugging-with-visualstudio.md)
- [在 Visual Studio 中远程调试 Windows 设备上的 PC 项目](/zh-CN/tools/tools-pc/visualstudio/gr-vs-debugging-with-visualstudio-remote-windows.md)