> ## Documentation Index
> Fetch the complete documentation index at: https://devdocs.xbox.com/llms.txt
> Use this file to discover all available pages before exploring further.
# 每日和每月 CDN 使用情况报告
> PlayFab 每日和每月 CDN 使用情况报告的概述,这些报告跟踪来自玩家的内容下载次数和传输的字节量。
## 每日内容使用情况报告
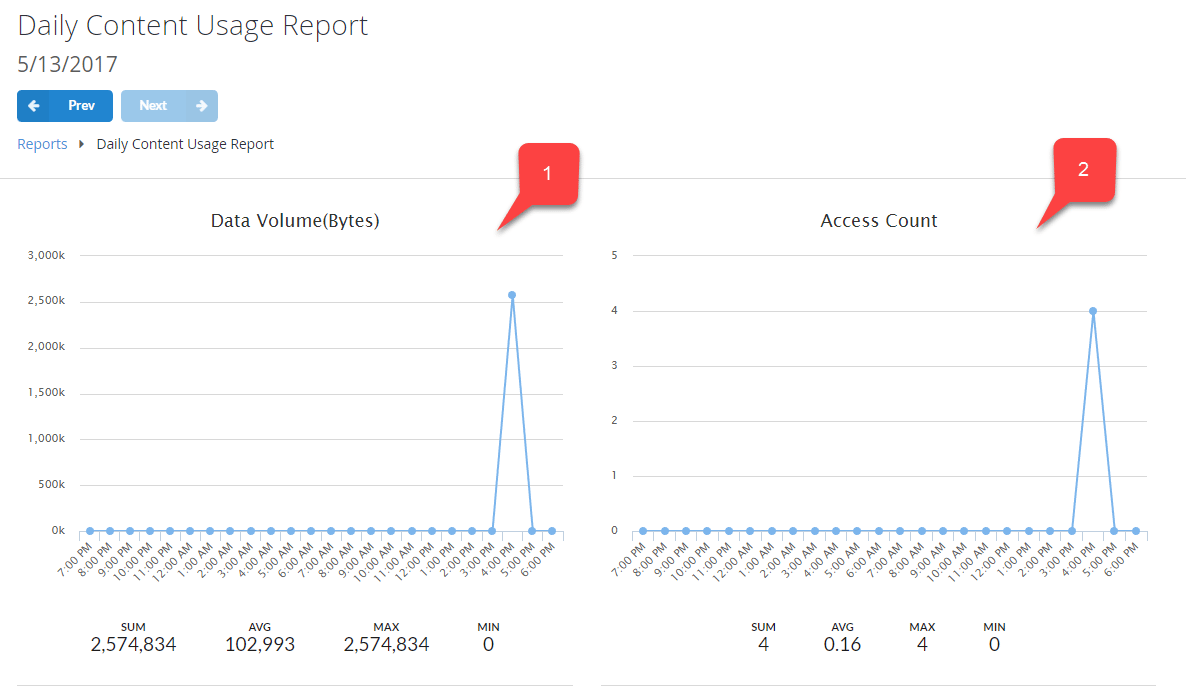
CDN 使用情况报告包含两张图表,展示 24 小时内的内容使用情况:
1. **Data Volume** 图表展示传输字节的分布情况。
2. **Access Count** 图表显示指定时段内内容下载的分布情况。
 ## 每月内容使用情况摘要报告
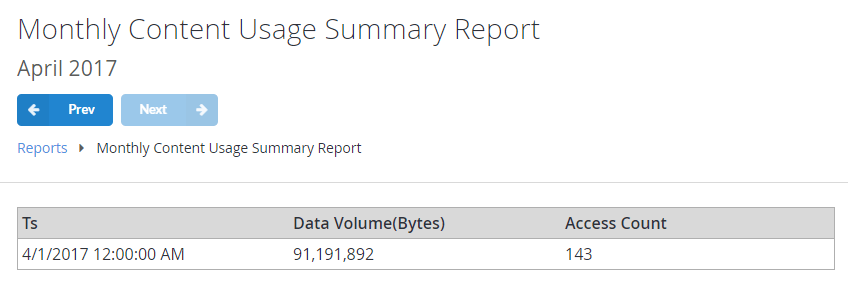
此报告汇总每月的内容使用情况。其中的表格包含在指定月份内传输的内容字节量,以及下载总数。
## 每月内容使用情况摘要报告
此报告汇总每月的内容使用情况。其中的表格包含在指定月份内传输的内容字节量,以及下载总数。
 ## 填充内容使用情况报告
下方模板中的代码可用于为报告引入一些数据。
```csharp theme={null}
public void GetContent()
{
PlayFabClientAPI.GetContentDownloadUrl(new GetContentDownloadUrlRequest() {
HttpMethod = "GET",
Key = "ContentKey"
}, result => {
// Implement your own Download function based on URL
DownloadContent(result.URL);
}, error => {
Debug.LogError(error.GenerateErrorReport());
});
}
```
需要注意的是,[GetContentDownloadUrl](xref:titleid.playfabapi.com.client.content.getcontentdownloadurl) API 调用本身不会在报告中产生新条目。
它只是为你提供内容下载的 URI。你可以使用任何 HTTP 请求技术来执行 GET 请求。完成后,将添加新条目并反映在两个报告中。
## 如何使用报告图表
PlayFab 报告图表都遵循相同的模型:
1. 在页面顶部区域,你通常会看到**控制面板**。它包含报告名称、观察时段以及用于在时段之间切换的 **Prev/Next** 按钮。
2. **图表面板**区域将可用数据显示为图表,其中横轴对应时间流,纵轴对应相关实例的数量——如 API 调用、购买、用户等(取决于报告类型)。
## 填充内容使用情况报告
下方模板中的代码可用于为报告引入一些数据。
```csharp theme={null}
public void GetContent()
{
PlayFabClientAPI.GetContentDownloadUrl(new GetContentDownloadUrlRequest() {
HttpMethod = "GET",
Key = "ContentKey"
}, result => {
// Implement your own Download function based on URL
DownloadContent(result.URL);
}, error => {
Debug.LogError(error.GenerateErrorReport());
});
}
```
需要注意的是,[GetContentDownloadUrl](xref:titleid.playfabapi.com.client.content.getcontentdownloadurl) API 调用本身不会在报告中产生新条目。
它只是为你提供内容下载的 URI。你可以使用任何 HTTP 请求技术来执行 GET 请求。完成后,将添加新条目并反映在两个报告中。
## 如何使用报告图表
PlayFab 报告图表都遵循相同的模型:
1. 在页面顶部区域,你通常会看到**控制面板**。它包含报告名称、观察时段以及用于在时段之间切换的 **Prev/Next** 按钮。
2. **图表面板**区域将可用数据显示为图表,其中横轴对应时间流,纵轴对应相关实例的数量——如 API 调用、购买、用户等(取决于报告类型)。
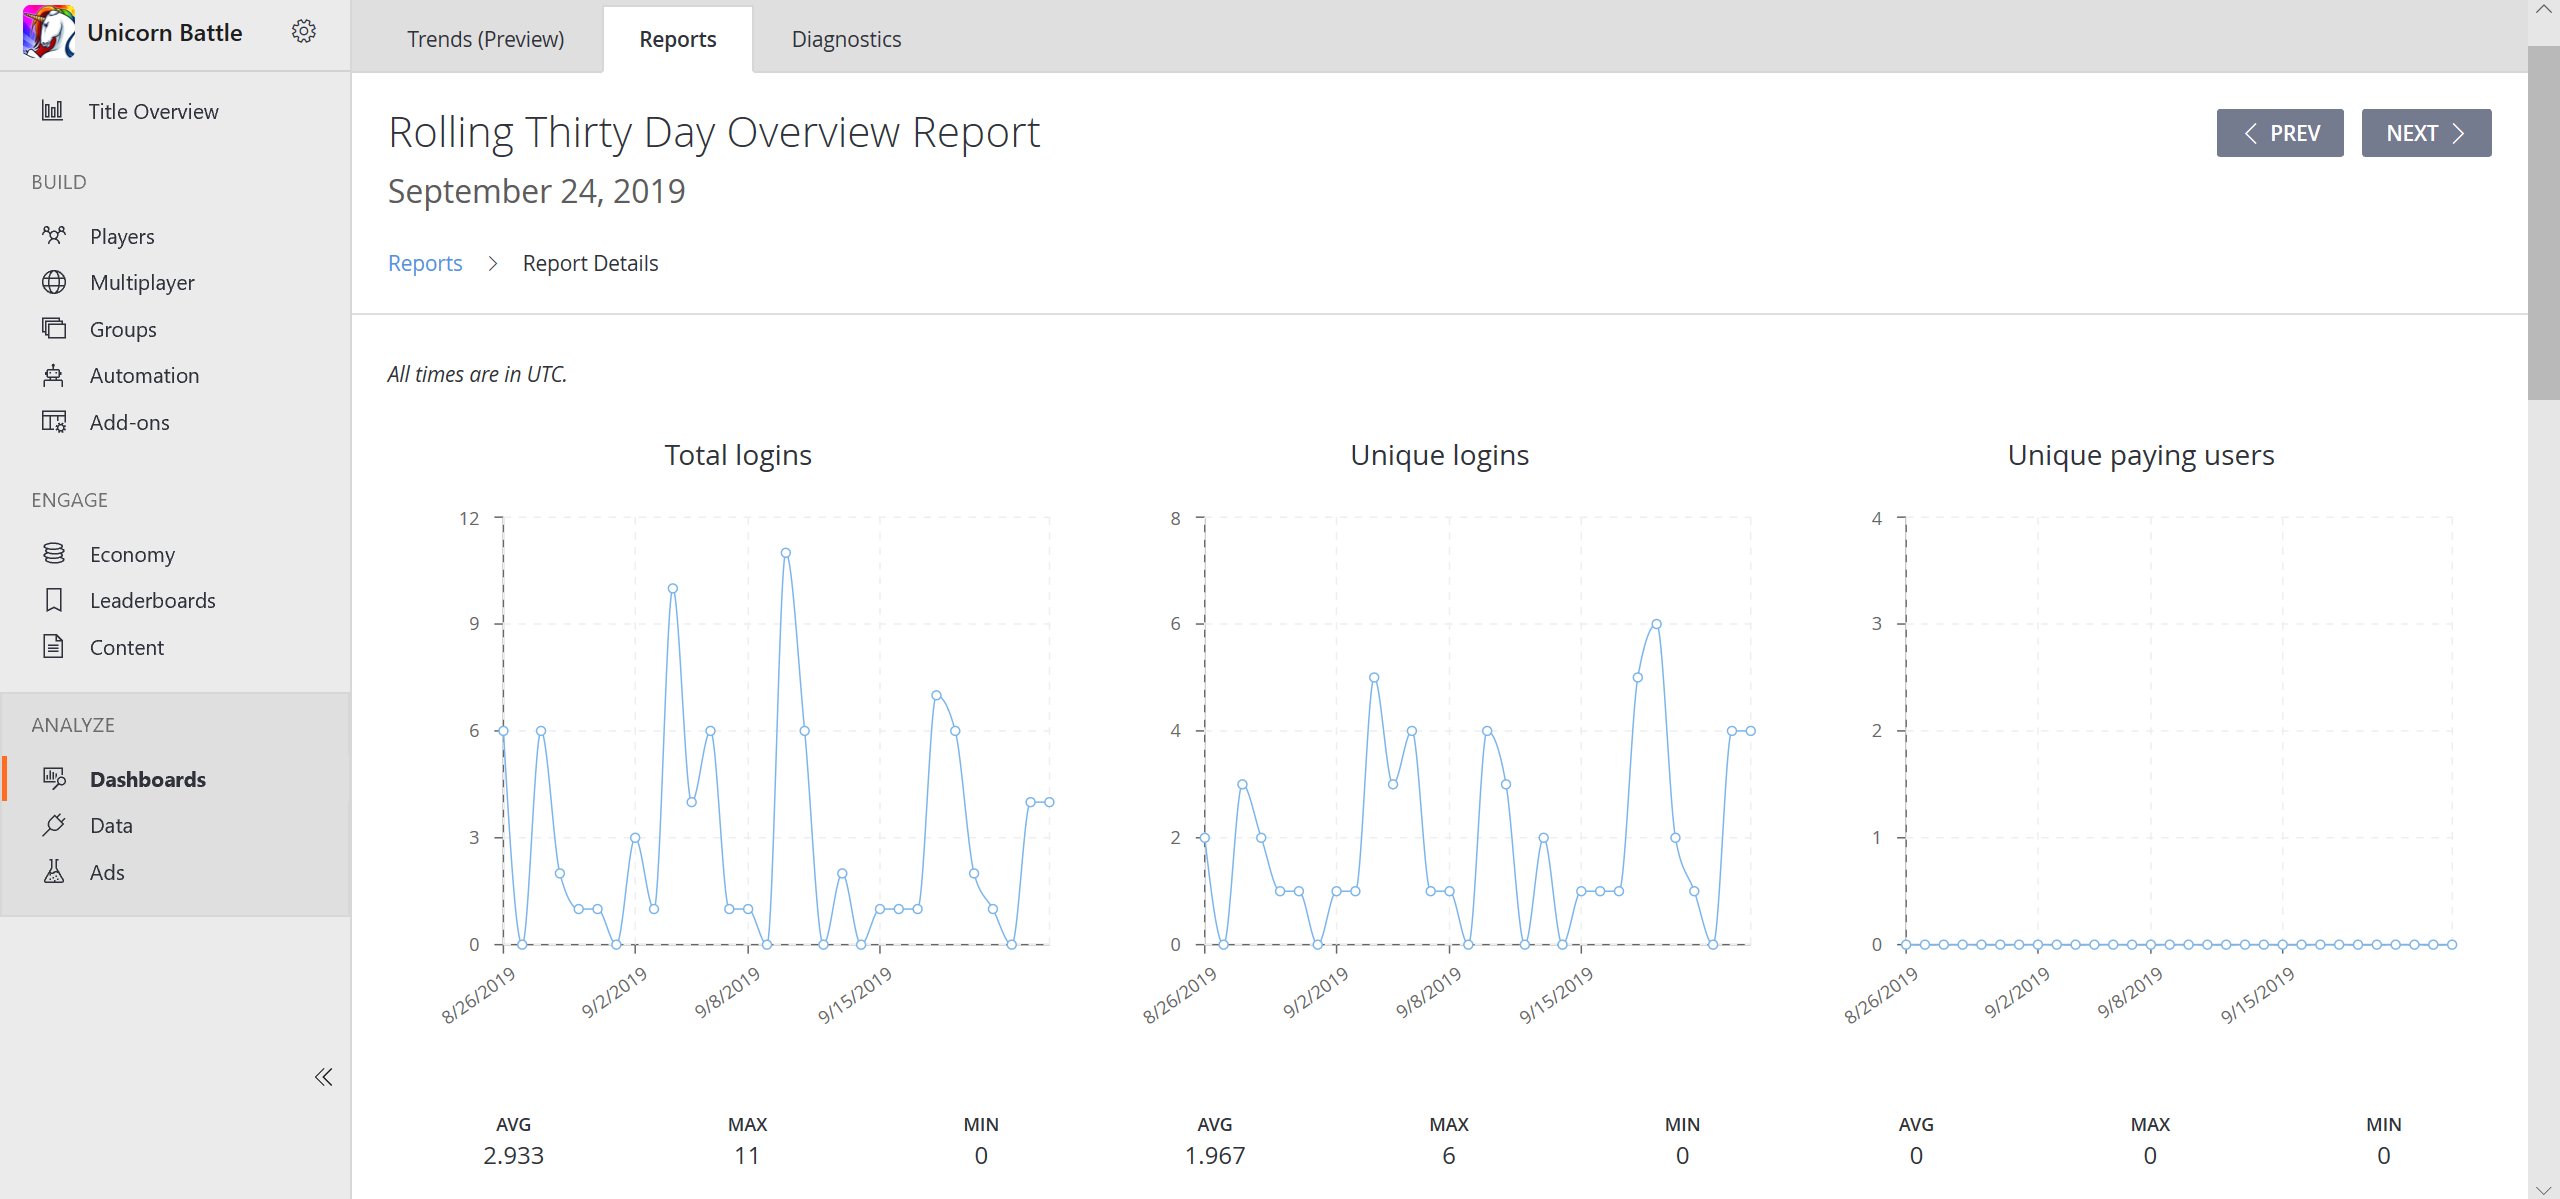 3. **Timeline** 区域中提供的指标包含该时段内所有实例的总和(**SUM**)、所有时间戳中的平均实例数(**AVG**)、峰值(**MAX**)以及最低值(**MIN**)。
## Related topics
- [报告快速入门](/zh-CN/services/playfab/data-analytics/learn-data/reports/quickstart.md)
- [每日和每月消费榜报告](/zh-CN/services/playfab/data-analytics/learn-data/reports/daily-and-monthly-top-spender-report.md)
- [每日和每月热销物品报告](/zh-CN/services/playfab/data-analytics/learn-data/reports/daily-and-monthly-top-items-report.md)
- [内容分发网络](/zh-CN/services/playfab/data-analytics/legacy/content-delivery-network/index.md)
- [什么是 PlayFab?](/zh-CN/services/playfab/get-started/what-is-playfab.md)
3. **Timeline** 区域中提供的指标包含该时段内所有实例的总和(**SUM**)、所有时间戳中的平均实例数(**AVG**)、峰值(**MAX**)以及最低值(**MIN**)。
## Related topics
- [报告快速入门](/zh-CN/services/playfab/data-analytics/learn-data/reports/quickstart.md)
- [每日和每月消费榜报告](/zh-CN/services/playfab/data-analytics/learn-data/reports/daily-and-monthly-top-spender-report.md)
- [每日和每月热销物品报告](/zh-CN/services/playfab/data-analytics/learn-data/reports/daily-and-monthly-top-items-report.md)
- [内容分发网络](/zh-CN/services/playfab/data-analytics/legacy/content-delivery-network/index.md)
- [什么是 PlayFab?](/zh-CN/services/playfab/get-started/what-is-playfab.md)