> ## Documentation Index
> Fetch the complete documentation index at: https://devdocs.xbox.com/llms.txt
> Use this file to discover all available pages before exploring further.
# XBOX Gaming Explorer
> XBOX Gaming Explorer
The XBOX Gaming Explorer is a window hosted within the Visual Studio integrated development environment (IDE) that streamlines common console-related developer workflows, primarily around debugging, launching processes, and monitoring the status of your consoles.
The XBOX Gaming Explorer integrates some common developer-focused features from [xbWatson](/tools/tools-console/xbWatson/xbwatson) and [XBOX Manager](/tools/tools-console/xbom/xbom), and simplifies access to common debugging scenarios. Use the XBOX Gaming Explorer to accomplish more from directly within the Visual Studio IDE.
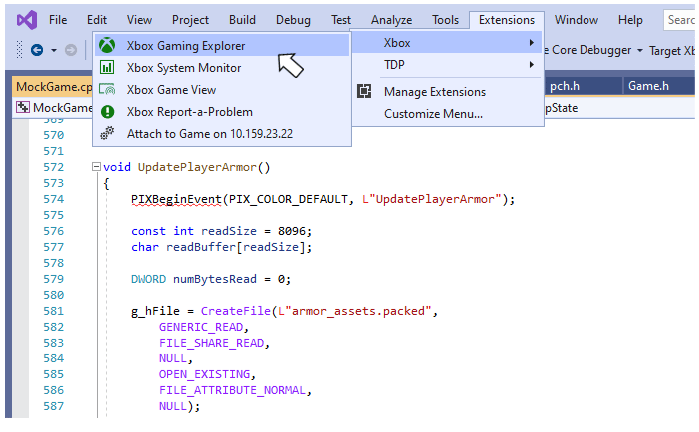
The XBOX Gaming Explorer can be accessed by using the XBOX menu in Visual Studio. The XBOX menu is under the Extensions menu as shown in the following figure.
 The features in the XBOX Gaming Explorer are grouped into three tabs: Console Details, Consoles, and XBOX Developer Tools Launcher. The ribbon used to select one of the four tabs also provides the ability to view this help page and to access the *Report A Problem* feature that is common to other tools such as [XBOX Manager](/tools/tools-console/xbom/xbom).
## Console Details
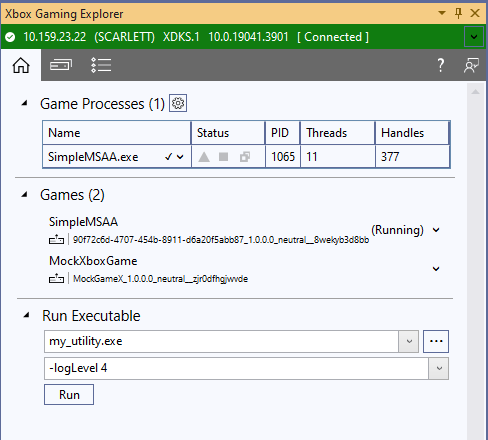
Use the Console Details tab to monitor the game process that is running on your console, launch and debug registered titles, cycle your title through the various [Process Lifetime Management](/build/console-features/console-workflows/xbox-game-life-cycle) (PLM) states, save minidumps and run executables on the console as shown in the following figure.
The features in the XBOX Gaming Explorer are grouped into three tabs: Console Details, Consoles, and XBOX Developer Tools Launcher. The ribbon used to select one of the four tabs also provides the ability to view this help page and to access the *Report A Problem* feature that is common to other tools such as [XBOX Manager](/tools/tools-console/xbom/xbom).
## Console Details
Use the Console Details tab to monitor the game process that is running on your console, launch and debug registered titles, cycle your title through the various [Process Lifetime Management](/build/console-features/console-workflows/xbox-game-life-cycle) (PLM) states, save minidumps and run executables on the console as shown in the following figure.
 ### Game Processes
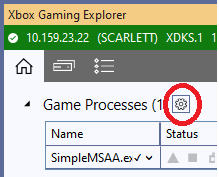
The title process and any utility programs running in the Game OS are listed in the *Game Processes* table. The columns displayed in the table show a process's current status along with its process identifier (PID) and the number of running threads and open handles. The set of columns displayed in the table can be changed using the gear icon next to the table heading.
### Game Processes
The title process and any utility programs running in the Game OS are listed in the *Game Processes* table. The columns displayed in the table show a process's current status along with its process identifier (PID) and the number of running threads and open handles. The set of columns displayed in the table can be changed using the gear icon next to the table heading.
 The *Status* column includes the following three icons.
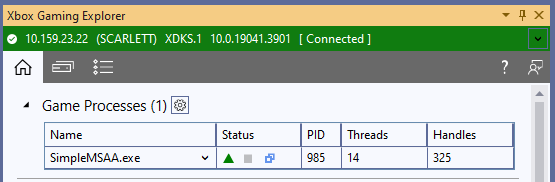
* The triangle icon turns green when a change has occurred in the process data within the last five seconds.
* The square icon turns red when the process has ended.
* The double-boxes icon turns light blue when a debugger is attached to the process.
These three icons are shown in the following figure.
The *Status* column includes the following three icons.
* The triangle icon turns green when a change has occurred in the process data within the last five seconds.
* The square icon turns red when the process has ended.
* The double-boxes icon turns light blue when a debugger is attached to the process.
These three icons are shown in the following figure.
 Select the arrow next to a process or right-click a table row to display a context menu as shown in the following figure. The context menu provides for the following actions:
* Attach to the process
* Terminate it the process
* Save a minidump
* Update the Visual Studio properties window that has information about that process.
Select the arrow next to a process or right-click a table row to display a context menu as shown in the following figure. The context menu provides for the following actions:
* Attach to the process
* Terminate it the process
* Save a minidump
* Update the Visual Studio properties window that has information about that process.
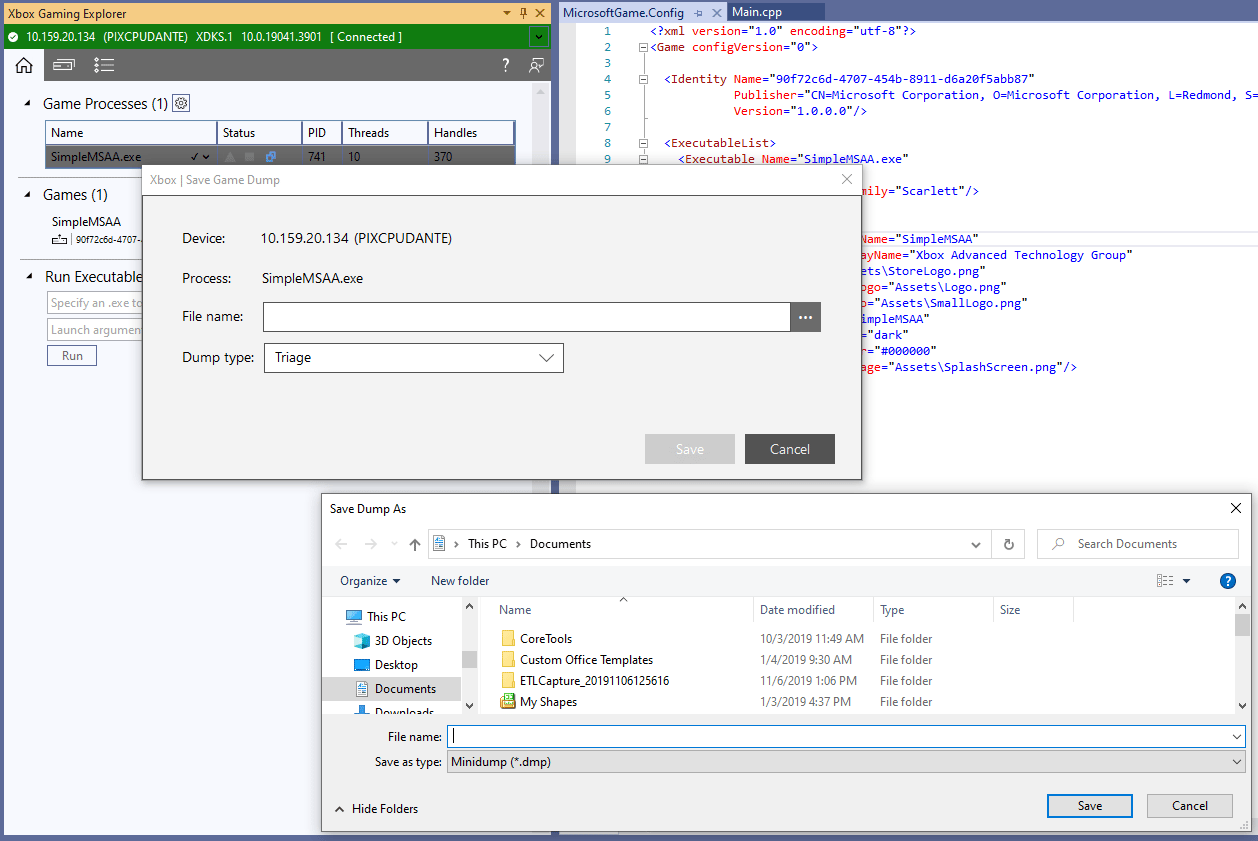
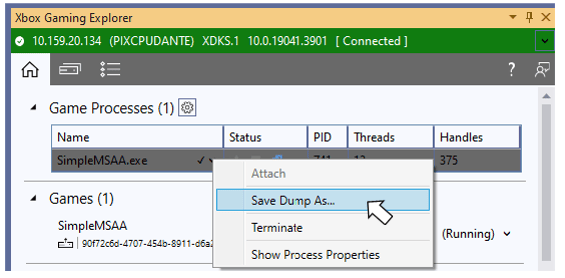 Selecting *Save Dump As...* from the context menu displays a dialog that lets you specify the type of minidump and the file on your development PC where the minidump will be saved, as shown in the following figure.
 ### Games
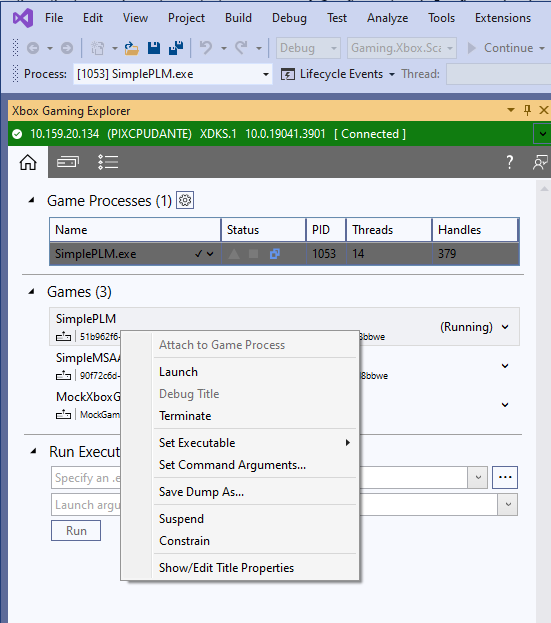
The Console Details tab includes a list of the titles that are registered on the current console. The *Games* list includes a context menu as shown in the following figure that can be used to perform the following actions:
* Launch, Terminate or Attach to a title
* Choose the title's executable to launch
* Set a title's command line arguments
* Save a minidump
* Transition a title to a different PLM state
* View a title's properties in the Visual Studio properties window.
### Games
The Console Details tab includes a list of the titles that are registered on the current console. The *Games* list includes a context menu as shown in the following figure that can be used to perform the following actions:
* Launch, Terminate or Attach to a title
* Choose the title's executable to launch
* Set a title's command line arguments
* Save a minidump
* Transition a title to a different PLM state
* View a title's properties in the Visual Studio properties window.
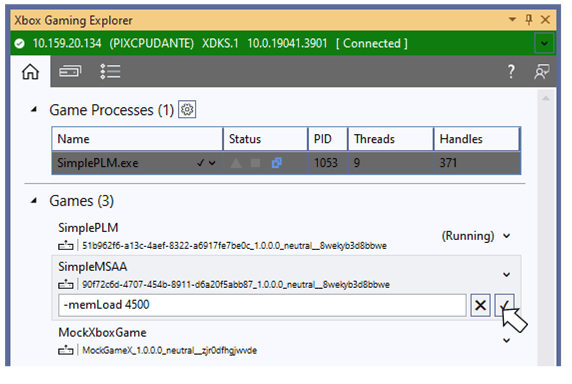
 Selecting the **Set Command Arguments...** context menu displays an edit box you can use to enter the arguments to be passed to the title when it is launched. After entering the arguments, select the **Save Parameters** button to cause the parameters to be passed to the title the next time it is launched.
 #### Editing Game Properties
Selecting the **Show/Edit Title Properties** menu item in the **Games** section of the console details view populates the Visual Studio properties page with a set of title properties. The properties are grouped into categories. The properties shown in boldface can be edited. The **Debugging** category contains properties that are common set in various debugging scenarios.
#### Editing Game Properties
Selecting the **Show/Edit Title Properties** menu item in the **Games** section of the console details view populates the Visual Studio properties page with a set of title properties. The properties are grouped into categories. The properties shown in boldface can be edited. The **Debugging** category contains properties that are common set in various debugging scenarios.
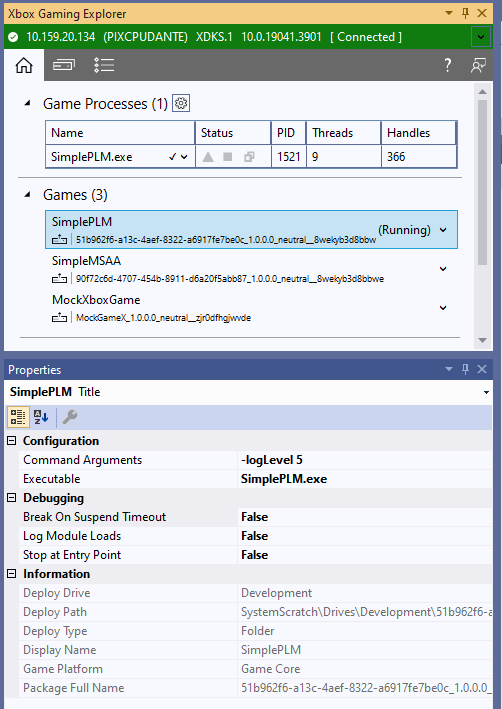 Selecting **True** from the **Break on Suspend Timeout** dropdown causes the debugger to break into your title if your suspend handler takes longer than 1 second to complete.
Selecting **True** from the **Log Module Loading** dropdown causes output from the operating system's loader to be displayed in the Visual Studio Output window during debugging. The loader's logging includes information about all the modules that the operating system loads, including redirects. Debugging DLL load failures (including "A dependent dll was not found") is a common use of this logging.
Selecting **True** from the **Stop at Entry Point** dropdown causes the debugger to break on the title's main entry point. This option is useful for debugging issues that occur early in title startup.
See [Visual Studio Properties for XBOX Development](/tools/tools-console/visualstudio/durango-property-pages) for more information on these properties.
The properties set using the properties page for a game only take effect if the game is launched from the XBOX Gaming Explorer. If you launch a project using F5, these settings won't take effect. To set these properties for launching via F5, use the properties page that can be accessed by right clicking on your project in the **Solution Explorer** and selecting the **Properties** context menu item.
### Run Executable
The Console Details tab provides the ability to launch tool executables on the console. These tools include those provided by the operating system or any tools developed by your studio. The tools launched by using the XBOX Gaming Explorer run in the Game OS, not the System OS. Use the **Run Executable** portion of the Console Details tab to specify the path to your tool on the console, along with any launch arguments. The output from any tool launched using **Run Executable** is shown in the **Gaming** output window in Visual Studio. In the following figure, **Run Executable** has been used to run the operating system utility **filever.exe** to list version information for all executables in the currently running title.
Selecting **True** from the **Break on Suspend Timeout** dropdown causes the debugger to break into your title if your suspend handler takes longer than 1 second to complete.
Selecting **True** from the **Log Module Loading** dropdown causes output from the operating system's loader to be displayed in the Visual Studio Output window during debugging. The loader's logging includes information about all the modules that the operating system loads, including redirects. Debugging DLL load failures (including "A dependent dll was not found") is a common use of this logging.
Selecting **True** from the **Stop at Entry Point** dropdown causes the debugger to break on the title's main entry point. This option is useful for debugging issues that occur early in title startup.
See [Visual Studio Properties for XBOX Development](/tools/tools-console/visualstudio/durango-property-pages) for more information on these properties.
The properties set using the properties page for a game only take effect if the game is launched from the XBOX Gaming Explorer. If you launch a project using F5, these settings won't take effect. To set these properties for launching via F5, use the properties page that can be accessed by right clicking on your project in the **Solution Explorer** and selecting the **Properties** context menu item.
### Run Executable
The Console Details tab provides the ability to launch tool executables on the console. These tools include those provided by the operating system or any tools developed by your studio. The tools launched by using the XBOX Gaming Explorer run in the Game OS, not the System OS. Use the **Run Executable** portion of the Console Details tab to specify the path to your tool on the console, along with any launch arguments. The output from any tool launched using **Run Executable** is shown in the **Gaming** output window in Visual Studio. In the following figure, **Run Executable** has been used to run the operating system utility **filever.exe** to list version information for all executables in the currently running title.
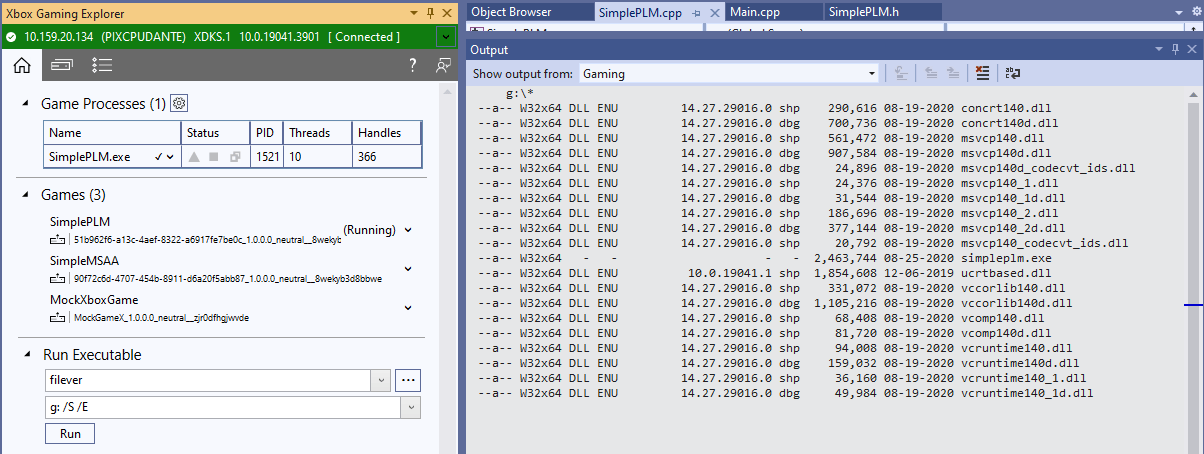 You must specify the fully qualified path to the executable you want to run, unless that executable is in the C:\windows\system32 directory in the Game OS on your console.
**Run Executable** can only be used to launch tool executables, not titles. Titles can be launched in a variety of ways, including the **Games** list in the XBOX Gaming Explorer, the Visual Studio F5 and Ctrl+F5 commands, [XBOX Manager](/tools/tools-console/xbom/xbom), [Windows Device Portal](/tools/tools-console/wdp/wdp), and [xbapp](/tools/tools-console/commandlinetools/xbapp).
## Consoles
The Consoles tab provides a list of the consoles you can connect to and use with the XBOX Gaming Explorer. If you've specified a default console with [XBOX Manager](/tools/tools-console/xbom/xbom) or [xbconnect](/tools/tools-console/commandlinetools/xbconnect), that console appears automatically in the XBOX Gaming Explorer. The default console is identified by an asterisk (\*) next to the icon representing the console.
Additional consoles can be added by using the *Add a Console* button on the Consoles tab as shown in the following figure.
You must specify the fully qualified path to the executable you want to run, unless that executable is in the C:\windows\system32 directory in the Game OS on your console.
**Run Executable** can only be used to launch tool executables, not titles. Titles can be launched in a variety of ways, including the **Games** list in the XBOX Gaming Explorer, the Visual Studio F5 and Ctrl+F5 commands, [XBOX Manager](/tools/tools-console/xbom/xbom), [Windows Device Portal](/tools/tools-console/wdp/wdp), and [xbapp](/tools/tools-console/commandlinetools/xbapp).
## Consoles
The Consoles tab provides a list of the consoles you can connect to and use with the XBOX Gaming Explorer. If you've specified a default console with [XBOX Manager](/tools/tools-console/xbom/xbom) or [xbconnect](/tools/tools-console/commandlinetools/xbconnect), that console appears automatically in the XBOX Gaming Explorer. The default console is identified by an asterisk (\*) next to the icon representing the console.
Additional consoles can be added by using the *Add a Console* button on the Consoles tab as shown in the following figure.
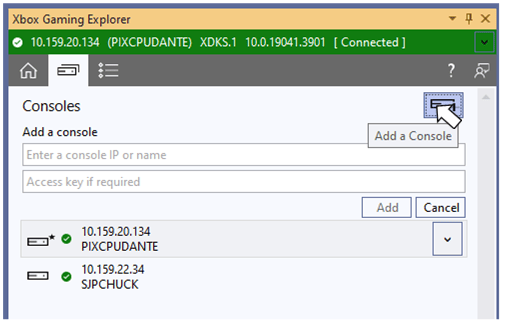 Selecting a console from the list connects to that console and updates the Console Details tab with the processes and titles from that console.
The list of consoles displayed in the XBOX Gaming Explorer and the list of consoles displayed in the XBOX Manager can get out of sync. These lists will be synchronized in a future release.
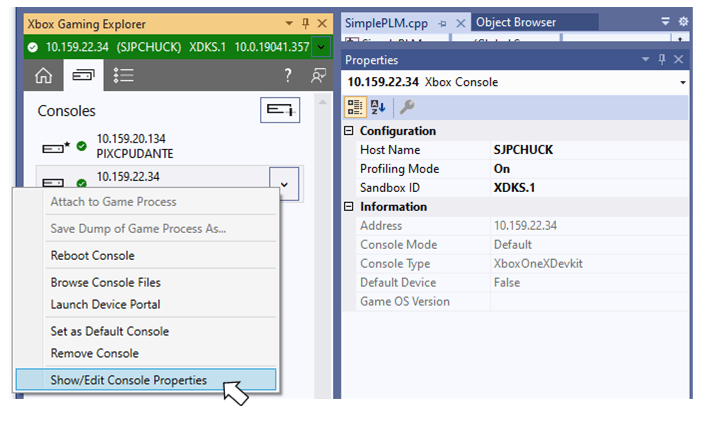
The console list has a context menu as shown in the following figure for performing various actions on the console, including populating the Visual Studio properties window with information about the console. Those properties that are shown in bold can be edited directly from the properties window.
Selecting a console from the list connects to that console and updates the Console Details tab with the processes and titles from that console.
The list of consoles displayed in the XBOX Gaming Explorer and the list of consoles displayed in the XBOX Manager can get out of sync. These lists will be synchronized in a future release.
The console list has a context menu as shown in the following figure for performing various actions on the console, including populating the Visual Studio properties window with information about the console. Those properties that are shown in bold can be edited directly from the properties window.
 ## XBOX Developer Tools Launcher
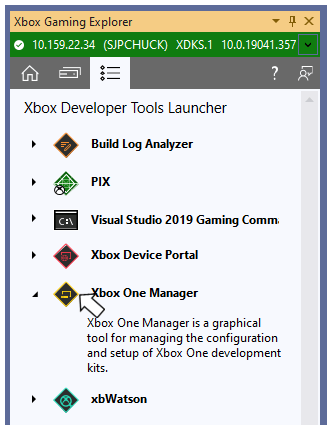
The XBOX Developer Tools Launcher tab as shown in the following figure provides a convenient way to launch other tools that ship in the Microsoft Game Development Kit (GDK). Launch a tool by selecting its name or icon.
## XBOX Developer Tools Launcher
The XBOX Developer Tools Launcher tab as shown in the following figure provides a convenient way to launch other tools that ship in the Microsoft Game Development Kit (GDK). Launch a tool by selecting its name or icon.
 ## See also
[Visual Studio](/tools/tools-console/visualstudio/visualstudio) [Retrieving crash dumps](/build/console-features/debugging-diagnostics/retrieving-crash-dumps)
## Related topics
- [Debugging XBOX projects by using Visual Studio](/tools/tools-console/visualstudio/debugging-with-visualstudio.md)
- [XBOX System Monitor](/tools/tools-console/visualstudio/xbox-system-monitor.md)
- [Visual Studio for console development](/tools/tools-console/visualstudio/visualstudio.md)
- [Visualstudio](/tools/tools-console/visualstudio/index.md)
- [XBOX Game View](/tools/tools-console/visualstudio/xbox-game-view.md)
## See also
[Visual Studio](/tools/tools-console/visualstudio/visualstudio) [Retrieving crash dumps](/build/console-features/debugging-diagnostics/retrieving-crash-dumps)
## Related topics
- [Debugging XBOX projects by using Visual Studio](/tools/tools-console/visualstudio/debugging-with-visualstudio.md)
- [XBOX System Monitor](/tools/tools-console/visualstudio/xbox-system-monitor.md)
- [Visual Studio for console development](/tools/tools-console/visualstudio/visualstudio.md)
- [Visualstudio](/tools/tools-console/visualstudio/index.md)
- [XBOX Game View](/tools/tools-console/visualstudio/xbox-game-view.md)